
FOR BETTER OR FOR WORSE:
MARRIAGE AND THE
FEDERAL INCOME TAX
JUNE 1997
The Congress of the United States
Congressional Budget Office

NOTES
Because numbers are often rounded, their sums may not equal totals shown in tables,
figures, and text.
For simplicity of exposition, this paper sometimes uses the term "families" to refer to
both families and individuals.
Values for earnings are sometimes negative. People can have negative earnings if
they lose money in self-employment and the losses exceed incomes from wages or
salaries.

T
Preface
his study examines the ways in which federal tax law affects the income taxes that
married couples pay and how demographic and labor market changes over the last two
decades have altered those effects. It also discusses a variety of possible changes in
the federal tax code that would reduce the higher tax liabilities that married couples often incur
because they cannot file individual tax returns. The Congressional Budget Office (CBO)
prepared the study at the request of Representative Barbara Kennelly of the Committee on
Ways and Means.
Roberton Williams and David Weiner of CBO's Tax Analysis Division wrote the study
under the direction of Rosemary Marcuss and Frank Sammartino. A number of people inside
and outside CBO reviewed drafts and provided valuable criticism and suggestions. They
include Mark Booth, Albert Davis, Theresa Devine, Daniel Feenberg, Diana Furchtgott-Roth,
Amy Rehder Harris, Richard Kasten, Pearl Richardson, and Eugene Steuerle.
Sherwood Kohn edited the manuscript and Marlies Dunson provided editorial assistance.
Simone Thomas produced drafts of the study. Kathryn Quattrone and Jill Sands prepared the
report for publication.
June E. O'Neill
Director
June 1997


Contents
SUMMARY xiii
ONE MARRIAGE PENALTIES AND BONUSES 1
Defining Marriage Penalties and Bonuses
2
A History of the Treatment of Married Couples
in the Federal Income Tax
6
The Significance of Marriage Penalties and Bonuses
9
TWO SOURCES OF MARRIAGE PENALTIES AND BONUSES 15
Factors Giving Rise to Marriage Penalties
and Bonuses
15
Which Couples Pay the Marriage Tax?
25
THREE MAGNITUDES OF MARRIAGE PENALTIES
AND BONUSES 27
Measuring Marriage Penalties and Bonuses
27
Total Marriage Penalties and Bonuses
29
The Distribution of Marriage Penalties
and Bonuses
32
Effective Tax Rates of Married Couples
36
FOUR LABOR MARKET AND DEMOGRAPHIC CHANGES
AFFECTING MARRIAGE PENALTIES AND BONUSES 37
Working-Age Married Couples
38
Changes in Earnings Among Income Categories
39
Changes in Earnings Among Age Categories
40
Changes in Earnings by Number of Children
42
Overview
44
FIVE REDUCING MARRIAGE PENALTIES 47
Widen Tax Brackets and Raise the Standard
Deduction for Joint Filers
48
Exempt from Taxes Some Income of
Lower-Earning Spouse
51

vi FOR BETTER OR FOR WORSE: MARRIAGE AND THE FEDERAL INCOME TAX June 1997
Modify Earned Income Tax Credit to Reflect
Number of Adult Earners
53
Restore the Requirement That Spouses File
Individual Returns
54
Allow Couples Choice of Filing Status
55
Fundamental Tax Reform
56
APPENDIXES
A Tax Treatment of Married Couples in
Other Countries
59
B Treatment of Married Couples Under State
Income Taxes
61
C Characteristics of Married and Unmarried
Couples, 1995
63
D Additional Supporting Tables
69
E Sources of Data
75
F Estimated Marriage Penalties and Bonuses
Under a Divorce Model
77
G The Income Distribution of Families
79
H Comparison of Demographic Changes for Working-Age
Couples and All Married Couples
83

CONTENTS vii
TABLES
S-1. Distribution of Joint Tax Returns and Marriage Penalty
or Bonus as a Percentage of Adjusted Gross Income,
by Adjusted Gross Income of Couple and Penalty or
Bonus Status, Projected 1996 xiv
S-2. Joint Tax Returns by Penalty or Bonus Status and
Division of Earnings Between Spouses, Projected 1996 xv
S-3. Effective Individual Income Tax Rates of Married Couples
Filing Individual or Joint Returns, Projected 1996 xvi
S-4. Alternative Approaches to Reducing Marriage Penalties xviii
1. Effects on Marginal Tax Rates of Married Couples Filing
Jointly Rather than Individually, Projected 1996 12
2. Marriage Penalties and Bonuses for Married and Unmarried
Couples, Simulated 1995 13
3. Factors Determining Whether Couples Face Marriage
Penalties or Bonuses, 1996 16
4. Total Value of and Tax Returns with Marriage Penalties
and Bonuses Under Alternative Measures, Projected 1996 30
5. Couples Receiving Marriage Penalties and Bonuses by
Adjusted Gross Income, Projected 1996 31
6. Marriage Penalties and Bonuses by Adjusted Gross Income
of Couple, Projected 1996 32
7. Joint Tax Returns by Penalty or Bonus Status and Division
of Earnings Between Spouses, Projected 1996 33
8. Marriage Penalties and Bonuses by Penalty or Bonus Status
and Division of Earnings Between Spouses, Projected 1996 34
9. Effective Individual Income Tax Rates of Married Couples
Filing Individual or Joint Returns, by Adjusted Gross
Income and Division of Earnings Between Spouses,
Projected 1996 35
10. Distribution of Working-Age Married Couples, by Division
of Earnings Between Spouses in 1969, 1979, 1989, and 1995 39
11. Percentage of Working-Age Married Couples with Two
Earners, by Total Income in 1969, 1979, 1989, and 1995 40

viii FOR BETTER OR FOR WORSE: MARRIAGE AND THE FEDERAL INCOME TAX June 1997
12. Percentage Distribution of Working-Age Married Couples, by
Division of Earnings Between Spouses and Total Income in
1969, 1979, 1989, and 1995 41
13. Percentage of Working-Age Married Couples with Two
Earners, by Age of Older Spouse in 1969, 1979, 1989, and 1995 42
14. Percentage Distribution of Working-Age Married Couples,
by Division of Earnings Between Spouses and Age of Older
Spouse in 1969, 1979, 1989, and 1995 43
15. Percentage of Working-Age Married Couples with Two
Earners, by Number of Children in 1969, 1979, 1989, and 1995 44
16. Percentage Distribution of Working-Age Married Couples,
by Division of Earnings Between Spouses and Number of
Children in 1969, 1979, 1989, and 1995 45
17. Percentage Distribution of Families with Children, by Type
and Number of Earners in Married Couples in 1969, 1979,
1989, and 1995 46
18. Simulated Effects of Demographic Change on Marriage
Penalties and Bonuses, 1969 and 1996 46
C-1. Distribution of Married and Unmarried Couples
by Total Income, 1995 65
C-2. Distribution of Married and Unmarried Couples
by Age of Older Spouse, 1995 66
C-3. Distribution of Married and Unmarried Couples
by Number of Children, 1995 67
C-4. Simulated Marriage Penalties and Bonuses for
Married and Unmarried Couples, 1995 68
D-1. Factors Determining Marriage Penalties and Bonuses
by Adjusted Gross Income, Simulated 1996 70
D-2. Married Couples by Earnings of Each Spouse, Simulated 1996 71
D-3. Married Couples with Marriage Penalties or Bonuses
and Average Penalty or Bonus by Earnings of Each
Spouse, Simulated 1996 72
D-4. Distribution of Marriage Penalties and Bonuses by
Number of Earners, Simulated 1996 74

CONTENTS ix
F-1. Marriage Penalties and Bonuses for Married Couples Under
Alternative Assumptions about Distribution of Children
Between Spouses, Simulated 1996 78
G-1. Percentage Distribution of Families by Income
Category and Family Type, 1995 80
G-2. Distribution of Working-Age Married Couples with
Earnings by Income Category in 1969, 1979, 1989, and 1995 81
H-1. Selection of Married Couples for Analysis Based
on Age and Earnings, 1995 84
H-2. Percentage of Couples with Two Earners: All Married
Couples and Working-Age Married Couples with Positive
Earnings in 1969, 1979, 1989, and 1995 85
H-3. Distribution of Working-Age and All Married Couples
by Division of Earnings Between Spouses in 1969,
1979, 1989, and 1995 86
H-4. Percentage Distribution of Working-Age and All Married
Couples with Two Earners, by Total Income in 1969, 1979,
1989, and 1995 87
H-5. Percentage Distribution of Working-Age and All Married
Couples by Division of Earnings Between Spouses and
Total Earnings in 1969, 1979, 1989, and 1995 88
H-6. Percentage Distribution of Working-Age and All Married
Couples with Two Earners by Age of Older Spouse in 1969,
1979, 1989, and 1995 90
H-7. Percentage Distribution of Working-Age and All Married
Couples by Division of Earnings Between Spouses and Age
of Older Spouse in 1969, 1979, 1989, and 1995 91
H-8. Percentage Distribution of Working-Age and All Married
Couples with Two Earners by Number of Children in 1969,
1979, 1989, and 1995 93
H-9. Percentage Distribution of Working-Age and All Married
Couples by Division of Earnings Between Spouses and
Number of Children in 1969, 1979, 1989, and 1995 94

x FOR BETTER OR FOR WORSE: MARRIAGE AND THE FEDERAL INCOME TAX June 1997
FIGURES
1. The Conflict Among Goals of Income Taxation 3
2. Earned Income Tax Credit by Number of Children
and Earnings, 1996 Tax Law 20
3. Marriage Penalties and Bonuses Resulting from the
Earned Income Tax Credit, 1996 Tax Law 22
4. Marriage Penalties and Bonuses by Number of
Children and Earnings Split, 1996 Tax Law 24
5. Work Patterns of Married Couples, 1969-1995 37
6. Distribution of Families and Unrelated Individuals
by Type, 1969-1995 38
7. Projected 1996 Marriage Penalty Relief Under Alternative
Proposals, Basic Measure of Marriage Penalty 49
8. Projected 1996 Target Efficiency of Alternative Proposals
to Relieve Marriage Penalties, Basic Measure of Marriage
Penalty 50
BOXES
1. A Marriage Penalty 4
2. A Marriage Bonus 5
3. 1996 Marriage Bonuses Resulting from Tax Brackets
for One-Earner Couples 18
4. 1996 Marriage Penalties Resulting from Tax Brackets
for Two-Earner Couples in Which Spouses Have
Equal Earnings 19
5. A Marriage Penalty for a Low-Income Couple
with Children 21
6. Alternative Measures of Marriage Penalties
and Bonuses 29
7. Setting Tax Brackets and Standard Deductions for
Joint Filers to Twice Those for Single Filers 48
8. The Two-Earner Deduction 52

CONTENTS xi
A-1. Tax Treatment of Earned Income in OECD Countries, 1993 60
B-1. Treatment of Married Couples Under State Income
Taxes, 1993 62


M
Summary
arriage affects the income taxes people pay,
sometimes causing married couples to pay
more than they would if they were single and
sometimes causing them to pay less. That is because
the household the married couple or the single indi-
vidual is the basic tax-paying unit in the U.S. system.
Differences in the tax liabilities of households reflect
attempts by the Congress to maintain balance in tax
treatment among different kinds of families. On the
one hand, the tax code seeks to levy the same tax on
couples with the same income, regardless of who earns
the income. On the other hand, the code tries to mini-
mize the effect of marriage on a couple's tax liability.
A tax structure with progressive rates, however, cannot
attain both goals. The incompatibility of those three
goals progressive rates, equal treatment of married
couples, and marriage neutrality results in a continu-
ing tension within the tax code. The third goal, mar-
riage neutrality, has proven to be the most elusive in
our system.
The balance among the goals has shifted over time,
partly in response to complaints of unfair treatment and
partly in reaction to changing demographic patterns.
Growing numbers of single taxpayers, the greater like-
lihood that husbands and wives both work, increasing
parity of earnings for husbands and wives who do
work, and changes in tax rate brackets have all contrib-
uted to the pressures on the balance.
Differences in income tax liabilities caused by mar-
ital status are embodied in a number of tax code provi-
sions, beginning with separate rate schedules for mar-
ried couples and single individuals. The most impor-
tant other differences are those in the standard deduc-
tion and the earned income tax credit (EITC). Those
factors cause most two-earner couples in which hus-
band and wife have roughly equal incomes to pay more
tax than they would if they could file individual tax re-
turns, incurring what has become known as a "marriage
penalty." At the same time, couples with just one
earner or in which husband and wife have quite differ-
ent incomes generally pay lower taxes as joint tax filers
than they would if they could file as single taxpayers.
Those couples receive what analysts have termed "mar-
riage bonuses."
Marriage penalties also exist outside the federal
income tax in the form of transfer program rules that
limit married couples' benefits to amounts below what
they would receive as single individuals. For example,
a low-income single mother might qualify for welfare
assistance, food stamps, and Medicaid, benefits that she
would lose if she obtained a good-paying job or married
a man who had a moderate income. That loss of bene-
fits can offset much of the income gains from work or
marriage, thus providing disincentives for each. Al-
though such marriage penalties outside the tax code can
be substantial and often are larger than those created
by the tax code this study addresses only the different
income taxes paid by joint and individual filers.
If marriage penalties and bonuses were small, they
would be of little consequence. Taxpayers would not
perceive as unfair the small differences in taxes created
by marriage. Perhaps more important, those differ-
ences would not lead people to change their behavior
toward work or marriage itself. But the penalties and
bonuses can be large. Empirical evidence indicates that
they may affect work patterns, particularly for a cou-

xiv FOR BETTER OR FOR WORSE: MARRIAGE AND THE FEDERAL INCOME TAX June 1997
ple's second earner. Joint tax filing often imposes a
substantially higher rate on a couple's second earner
than does individual filing. The higher rates reduce the
after-tax wage and may cause second earners to work
fewer hours or not to work at all, thus reducing eco-
nomic efficiency. Furthermore, large differences in tax
liabilities between otherwise similar couples lead to
perceptions of unfairness and calls for changes in the
tax code that would reduce those differences.
The size and imposition of marriage penalties and
bonuses depend on which components of the tax code
are included in their measurement. In general, the more
components of the code that are included in the yard-
stick, the more couples incur marriage penalties and the
fewer couples receive bonuses. The components in-
cluded depend on which taxpaying circumstances are
assumed. The measure used in this study includes the
code components that account for the bulk of the pen-
alty and bonus amounts. The estimates of those penal-
ties and bonuses, however, assume no induced changes
in labor supply or marriage and thus underestimate the
economic costs involved.
To be more specific, marriage penalties and bo-
nuses occur because the tax code allows different stan-
dard deductions in determining the taxable incomes of
couples and single taxpayers, has different tax rates for
given levels of taxable income for the two groups, and
provides the EITC without regard to marital status.
Couples in which spouses have similar incomes gener-
ally can claim smaller deductions, face higher marginal
tax rates, and lose some or all of the EITC they would
have if they filed individual tax returns and thus in-
curred marriage penalties. Couples in which one
spouse earns much less than the other or does not work
face the opposite situation. They may qualify for larger
deductions, incur lower tax rates, and receive more
EITC than under individual filing and thus receive mar-
riage bonuses.
Distribution of
Marriage Penalties
And Bonuses
An estimated 42 percent of couples incurred marriage
penalties in 1996, 51 percent received bonuses, and 6
percent paid taxes unaffected by their marital status
(see Summary Table 1). That distribution varies mark-
edly across the income distribution. Only 12 percent of
couples with incomes below $20,000 had penalties and
63 percent received bonuses. Couples with incomes
between $20,000 and $50,000 were somewhat more
likely to receive bonuses than to incur penalties,
whereas couples with incomes above $50,000 were
somewhat more likely to incur penalties than to receive
bonuses.
Measured as a percentage of income, marriage pen-
alties and bonuses are largest for low-income families
and least for high-income families (see Summary
Table 1). Couples with incomes below $20,000 who
bear penalties are estimated to pay nearly 8 percent
Summary Table 1.
Distribution of Joint Tax Returns and Marriage
Penalty or Bonus as a Percentage of Adjusted
Gross Income, by Adjusted Gross Income of
Couple and Penalty or Bonus Status,
Projected 1996
Less Than $20,000- More Than All
$20,000 $50,000 $50,000 Incomes
Returns in Income Category (Percent)
With Penalties12445442
Unaffected 25136
With Bonuses 63
55 44 51
All Returns 100 100 100 100
Penalty or Bonus as a Percentage
of Adjusted Gross Income
Penalties 7.6 3.2 1.6 2.0
Bonuses 5.0 2.6 2.0 2.3
Total Penalties and Bonuses (Billions of dollars)
Penalties 0.9 9.6 18.3 28.8
Bonuses 3.9
8.7 20.3 32.9
Net Effect on
Tax Liability -3.0 0.9 -2.0 -4.1
a
SOURCE: Congressional Budget Office simulations based on data
from the 1993 Statistics of Income.
a. Positive values indicate net penalties; negative values indicate net
bonuses.

SUMMARY xv
more of their income in taxes measured at 1996 income
levels than they would pay if they could file individual
tax returns. For their counterparts who received them,
however, bonuses averaged 5 percent of income. Be-
cause bonus recipients in that income category far out-
number those incurring penalties, low-income married
couples received a net bonus of $3 billion. Both penal-
ties and bonuses for middle-income couples averaged
roughly 3 percent of the incomes of affected families.
Slightly higher average penalties offset a slightly lower
proportion of couples with penalties, yielding a net pen-
alty of nearly $1 billion. Couples with incomes over
$50,000 received a total net bonus of $2 billion. Cou-
ples with bonuses saved 2 percent of their incomes by
filing jointly, more than offsetting the added taxes
equal to 1.6 percent of income paid by penalized
couples.
Couples with a more equal division of incomes be-
tween husband and wife are more likely to incur mar-
riage penalties and less likely to receive bonuses than
couples in which one spouse has significantly less in-
come than the other or does not work at all. One-earner
couples received seven-eighths of the total value of bo-
nuses in 1996 but represented less than one-half of all
couples (see Summary Table 2). On net, their income
tax liabilities were nearly $29 billion lower than if they
were required to file individual tax returns. By
contrast, the one-quarter of all couples in which hus-
band and wife both earn at least one-third of the cou-
Summary Table 2.
Joint Tax Returns by Penalty or Bonus Status and Division of Earnings Between Spouses, Projected 1996
Both Spouses
Each Spouse Had Earnings
Earned and One Spouse
at Least Contributed Only One
One-Third of More Than Spouse
Couple's Two-Thirds of Had All
Earnings Couple's Earnings Earnings Couples
a
Joint Returns in Penalty or Bonus Category (Percent)
With Penalties 52 48 0 100
Unaffected 21 5 75 100
With Bonuses 2 21 77 100
All Joint Tax Returns 25 31 44 100
Total Penalty or Bonus (Billions of dollars)
Penalties 15.2 13.6 0 28.8
Bonuses 0.1
4.4 28.5 32.9
Net Effect on Tax Liability 15.1 9.2 -28.5 -4.1
b
SOURCE: Congressional Budget Office projections based on data from the 1993 Statistics of Income.
a. Couples with no earners and those with one earner incur similar marriage penalties and bonuses and are thus combined in the analysis. For
simplicity of exposition, the text refers to both types of couples as having one earner.
b. Positive values indicate net penalties; negative values indicate net bonuses.

xvi FOR BETTER OR FOR WORSE: MARRIAGE AND THE FEDERAL INCOME TAX June 1997
ple's income filed one-half of all joint returns incurring
marriage penalties but only 2 percent of those receiving
bonuses. As a result, those couples paid $15 billion
more in taxes than they would have if they could have
filed as individuals. Those estimates are based on ob-
served earnings under current tax laws, however, and
do not take account of the costs of couples altering their
work and marriage patterns in response to the tax code.
Although the prevalence of marriage penalties and
bonuses indicates that the tax code fails to provide mar-
riage neutrality, it is more successful in achieving equal
treatment of married couples with similar incomes. If
couples were required to file individual tax returns,
those with one earner would face substantially higher
tax rates than those with two earners who have roughly
equal incomes (see Summary Table 3). Because the tax
code generally requires couples to file jointly, those
with different divisions of earnings between spouses
incur more nearly equal tax rates. Marriage penalties
and bonuses arise from this equalization of tax rates for
couples with different divisions of earnings.
Summary Table 3.
Effective Individual Income Tax Rates of
Married Couples Filing Individual or
Joint Returns, Projected 1996 (In percent)
Both Spouses
Each Spouse Had Earnings
Earned and One Spouse
at Least Contributed Only One
One-Third of More Than Spouse
Tax Filing Couple's Two-Thirds of Had
Status Earnings Couple's Earnings Earnings
a
Joint 13.2 15.2 15.0
Individual 11.2 14.3 17.6
SOURCE: Congressional Budget Office projections based on data
from the 1993 Statistics of Income.
NOTE: Effective tax rates equal federal individual income tax liability
as a percentage of adjusted gross income.
a. Couples with no earners and those with one earner incur similar
marriage penalties and bonuses and are thus combined in the
analysis. For simplicity of exposition, the text refers to both types
of couples as having one earner.
Demographic Changes
Affecting Marriage
Penalties and Bonuses
In the last two decades, a sharp rise in the share of mar-
ried couples with two earners has taken place, accom-
panied by increasing equality of the earnings of hus-
bands and wives, particularly among couples with
higher incomes. Those changes, occurring for couples
with and without children, have contributed to a rise in
the share of couples incurring marriage penalties.
Between 1969 and 1995, the proportion of working-
age married couples with two workers grew from 48
percent to 72 percent. By itself, that shift tended to
increase marriage penalties and reduce bonuses. Off-
setting that trend, however, was a decline in married
couples as a share of all families and individuals: cou-
ples made up two-thirds of all such tax units in 1969,
but only one-half by 1995. Thus, a smaller fraction of
tax returns are now joint (and hence may be subject to
marriage penalties and bonuses) than was the case a
generation ago.
The shift toward two-earner couples has been ac-
companied by increasing equality of the incomes of
husbands and wives. Between 1969 and 1995, the frac-
tion of working-age couples in which both husband and
wife earned at least one-third of the couple's income
doubled from 17 percent to 34 percent. The greater
equality of spouses' earnings increased both the share
of couples incurring marriage penalties and the size of
those penalties.
Those changes in earnings patterns for married cou-
ples occurred for all subgroups defined by earnings,
age, and presence and number of children. However,
the changes were largest among couples with the high-
est incomes, those with both spouses under age 55, and
those with children.
If the demographic characteristics of married cou-
ples had not changed between 1969 and 1996, more
couples would have received bonuses under 1996 tax
law and fewer would have incurred penalties. Simula-
tions indicate that without the demographic change of
the last quarter century, two-thirds of couples would get
bonuses and less than one-third would pay penalties

SUMMARY xvii
under joint filing, compared with the nearly even split
between the two categories in 1996.
Reducing Marriage Penalties
Recent growth in the number of married couples who
incur marriage penalties and the increasing size of those
penalties have focused attention on the effects of mar-
riage on taxes and on alternative ways to alleviate them.
One approach involves relatively minor alterations of
the current tax code such as changes in tax brackets and
standard deductions, restoration of the two-earner de-
duction, or credits to offset penalties. More significant
changes would allow couples to file either joint or sin-
gle returns or require that all taxpayers file individual
returns. Finally, comprehensive tax reform, replacing
the current income tax with either a simpler tax on in-
comes or some form of consumption tax, would entail
some pattern of penalties and bonuses unless individual
filing was incorporated into the new system.
Changes in the tax code that reduce or eliminate
marriage penalties face an inevitable trade-off: cutting
penalties means lower taxes for some couples and ei-
ther reduced federal tax revenues or higher taxes on
other taxpayers. Revenue-neutral options require a re-
distribution of taxes from those now incurring penalties
to other taxpayers, either couples now receiving bo-
nuses or single people.
Six basic approaches address the problem of mar-
riage penalties directly (see Summary Table 4). Com-
bining options would generate interactions in ways not
analyzed in this study.
o
Widen Tax Brackets and Raise the Standard De-
duction for Joint Filers.
Increasing tax bracket
widths and standard deductions for joint filers to
twice those for single people would reduce total
marriage penalties by nearly one-half at an esti-
mated revenue cost of about $25 billion measured at
1996 income levels. Nearly 90 percent of tax reduc-
tions would accrue to couples with incomes above
$50,000. Half would go to those receiving bonuses
under current law.
o
Exempt from Taxes Some Income of the Lower-
Earning Spouse.
Exempting some earnings of
lower-earning spouses would ease the high marginal
tax rates they may face on even low amounts of
earnings. For example, restoring the 10 percent de-
duction for up to $30,000 of earnings would reduce
total marriage penalties by one-third at an estimated
cost of about $9 billion in lost revenues measured at
1996 income levels. Principal beneficiaries would
be couples with incomes between $50,000 and
$100,000, for whom penalties would fall by more
than one-half. Couples with lower incomes would
see their penalties decline by about one-tenth.
o
Modify the EITC to Reflect Number of Adult Earn-
ers.
A significant share of the marriage penalties
incurred by low-income couples is caused by the
loss of EITC when individual incomes are com-
bined. Providing two-earner couples with EITC pa-
rameters double those for single-earner tax units
would reduce marriage penalties for low-income
couples by about one-fourth, producing an estimated
revenue loss of about $4 billion measured at 1996
income levels. Virtually all of the benefits would go
to couples with incomes below $50,000, and less
than 1 percent would go to those now receiving bo-
nuses because of the EITC. Nearly 3.7 million cou-
ples would become newly eligible for the EITC.
o
Require Spouses to File Individual Tax Returns.
Requiring all taxpayers to file single returns would
eliminate all marriage penalties and bonuses, but
would redistribute roughly $30 billion in tax liabili-
ties from couples now receiving bonuses to those
incurring penalties. Marriage would no longer affect
a couple's tax bill. Although revenue gains from
lost bonuses would outweigh revenue lost in elimi-
nated penalties, yielding an estimated $4 billion in
net additional revenue in 1996, changes in the tax
liabilities of couples would be enormous. The 25
million couples now receiving bonuses would pay an
average of $1,300 in added taxes, and 21 million
couples now incurring penalties would find their
taxes down an average of nearly $1,400.
o
Allow Couples to Choose Filing Status.
Allowing
couples to choose to file either jointly or as individu-
als would eliminate all marriage penalties at an esti-

xviii FOR BETTER OR FOR WORSE: MARRIAGE AND THE FEDERAL INCOME TAX June 1997
mated cost of about $29 billion in lost revenues
measured in 1996 income levels. All existing mar-
riage bonuses would continue.
A less extreme version of that approach would allow
couples a tax credit based on a simplified calcula-
tion of the marriage penalty they now pay. If that
calculation was limited to earnings, standard deduc-
tions, and a single personal exemption for each
spouse, the resulting credits would cut total mar-
riage penalties by about one-third, producing an es-
timated revenue loss of about $10 billion measured
at 1996 income levels. Couples with incomes above
$50,000 would have their penalties cut by one-half,
whereas low-income couples would be relieved of
just one-tenth of their current penalties, largely be-
cause the credit would ignore the EITC.
o
Fundamental Radical Tax Reform.
Fundamental
changes in the federal tax system such as those dis-
Summary Table 4.
Alternative Approaches to Reducing Marriage Penalties
Share Share to Tax Units (Percent)
of With With
Revenue Loss Penalty Incomes Incomes Currently
a
(Billions of Removed Below Above Receiving
b
Approach dollars) (Percent) $20,000 $50,000 Bonuses
cc d
Set Standard Deduction and Width of
Tax Brackets for Joint Filers Equal to
Double Those for Single Filers 25 44 6 87 51
Restore Two-Earner Deduction 9 32 1 82 10
Double Earned Income Tax Credit
Parameters for Two-Earner Couples 4 12 41 1 1
Require Spouses to
File Individual Returns -4 100 e e e
Allow Couples to
Choose Filing Status 29 100 3 64 0
Replace Income Tax
with Consumption Tax f f f f f
SOURCE: Congressional Budget Office simulations.
NOTE: See text for complete description of approaches.
a. Negative value indicates revenue gain because tax increases for some taxpayers exceed tax reductions for others.
b. Total tax reduction for couples currently incurring tax penalty as a percentage of current total tax penalty.
c. Percentage of revenue loss going to couples with income in given range. Share includes tax reductions for couples getting either penalties or
bonuses.
d. Fraction of total revenue loss going to couples currently receiving marriage bonuses.
e. All couples incurring penalties get tax reductions equal to penalties. All couples receiving bonuses incur tax increases equal to bonuses. Shares
going to each income group and to those receiving bonuses are misleading and therefore not shown.
f. Revenue loss depends on formulation of consumption tax. Distribution among income groups and to those now receiving bonuses cannot be
determined.

SUMMARY xix
cussed during the 104th Congress could markedly
reduce marriage penalties. Moving to a flat
(single-rate) tax, for example, would eliminate all
penalties (and bonuses) resulting from tax brack-
ets. If reform also eliminated other tax features
such as standard deductions and the EITC, penal-
ties and bonuses arising from those features would
also disappear. Alternatively, switching from a tax
on income to a tax on consumption would wipe out
all marriage penalties and bonuses if exemptions
from the tax were independent of marital status and
marriage did not affect a couple's combined con-
sumption.


F
Chapter One
Marriage Penalties and Bonuses
ederal income tax laws generally require that a
married couple file a joint tax return based on
the combined income of husband and wife. As
a result, husbands and wives with similar incomes usu-
ally incur a larger combined tax liability than they
would if they could file individually. At the same time,
spouses who have markedly different incomes but file
as a couple generally face smaller tax bills than they
would if they were single. Those two possibilities, of-
ten referred to as marriage "penalties" and "bonuses,"
result from conflicting goals of a tax system that at-
tempts to balance fairness between married and unmar-
ried couples, among married couples, and among tax-
payers with differing incomes.
Under 1996 tax law, a married couple could face a
federal tax bill that was more than $20,000 higher than
the amount they would pay if they were not married and
could file individual tax returns, whereas other couples
may find that filing a joint tax return reduces their tax
bill by more than $4,000. Although there are various
1
ways of defining marriage penalties and bonuses, one
broad measure indicates that more than 21 million mar-
ried couples paid an average of nearly $1,400 in addi-
tional taxes in 1996 because they must file jointly,
whereas another 25 million found that the benefits of
filing jointly decrease their tax bills by an average of
about $1,300. Marriage penalties totaled about $29
billion in 1996, and bonuses added up to roughly $33
billion.
Marriage penalties are a relatively recent aspect of
federal income taxes, the result of changes made in the
tax code in 1969 to redress what some individuals
viewed as unfairly high taxes paid by single people.
Although the impact and size of marriage penalties and
bonuses have changed over the years with changes in
the tax code, recent tax increases in the form of addi-
tional tax brackets, and shifts in the work patterns of
married couples have combined to expand the propor-
tion of couples subject to penalties and boost the mag-
nitude of those payments. Those movements have
raised interest in policies that would reduce the impact
of marriage penalties in the tax code.
Marriage penalties and bonuses are not deliberately
intended to punish or reward marriage. Rather they are
the result of a delicate balance among disparate goals of
the federal income tax system. Largely for historical
reasons, the United States imposes income taxes not on
individuals as do most other industrialized nations, but
on couples, regardless of the division of incomes be-
tween spouses. Under a progressive structure of tax
rates, treating families equally generally means that a
couple's taxes will differ depending on their marital
status. Over time, the ebb and flow of political pres-
sures have shifted the equilibrium between marriage
penalties and bonuses as the Congress has attempted to
balance the competing demands of married and unmar-
ried taxpayers. Shifting demographics, particularly the
1. Federal income taxes are only one source of marriage penalties. Oth-
ers include state and local income taxes and federal transfer programs
such as Social Security, in which benefits depend in part on both mari-
tal status and resources. This study does not consider any effects of
marriage beyond those affecting a couple's federal individual income
tax liability. Two recent studies that examine the broader question
of marriage penalties and bonuses are Linda Giannarelli and Eugene
Steuerle,
The Twice-Poverty Trap: Tax Rates Faced by AFDC Re-
cipients
(Washington, D.C.: Urban Institute, April 1995), and Stacy
Dickert-Conlin and Scott Houser,
Taxes and Transfers: A New Look
at the Marriage Penalty
(unpublished working paper, Lexington:
University of Kentucky, July 1996).

2 FOR BETTR OR FOR WORSE: MARRIAGE AND THE FEDERAL INCOME TAX June 1997
growing proportion of couples with two earners, have
exerted further pressures on that fragile equilibrium.
Whether a couple incurs a penalty or receives a bo-
nus in their taxes depends on the level of their income,
the division of earnings between husband and wife, and
how many children they have. Over the last quarter
century, as more wives have entered the labor force and
their wages have risen in relation to men's, earnings of
spouses have grown more equal. The change increases
the likelihood that a couple will incur a tax penalty, as
compared with two single people whose earnings are
the same. Changes in demographics and earnings alone
appear to have increased by one-half the proportion of
couples incurring marriage penalties.
In 1995, the House of Representatives passed legis-
lation that would slightly lower the tax penalty imposed
on married couples, which would have cost $2 billion
annually in reduced government revenues. That same
year the Senate included in its budget reconciliation bill
a provision that would, over a 10-year period, raise the
standard deduction for married couples filing jointly to
twice that of single filers. When fully phased in, that
change would reduce the marriage penalty for many
couples and increase the marriage bonus for others at
an annual cost of roughly $5 billion in lower revenues.
Other options that would further reduce or eliminate
marriage penalties could have significantly higher reve-
nue costs.
Definin
g
Marria
g
e Penalties
and Bonuses
Marriage penalties and bonuses in the federal individual
income tax are defined as the increase or decrease in
taxes that some married couples incur because they pay
taxes as couples rather than as individuals. Penalties
and bonuses result from the tax code's pursuit of three
conflicting goals: equal treatment of married couples,
marriage neutrality, and progressive taxation.
Equal Treatment of Married Couples
According to the principle of equal treatment, married
couples who have equal incomes should pay the same
income taxes, regardless of the way earnings are di-
vided between spouses. Thus, a couple in which each
spouse earns half the income should pay the same taxes
as a couple with the same income but in which only one
spouse works. That concept runs afoul of equity princi-
ples when married couples with equal incomes have
different abilities to pay. A prime example involves
one- and two-earner families with the same total in-
come. Because the nonearning spouse has time to per-
form household tasks, the one-earner couple is better
off than the couple with two workers, which often has
to pay for such services as child care and household
chores. It thus has a greater ability to pay and, by some
standards of equity, should pay higher taxes. But deter-
mining the difference in ability to pay is difficult, if not
impossible, and the government has shied away from
imposing different taxes on that basis.
Marriage Neutrality
Under the principle of marriage neutrality, a couple's
income tax bill should not depend on their marital sta-
tus. Without neutrality, the tax code would provide an
incentive, even though it is small, for couples either to
marry
if marriage would lower their tax bill or to
remain single if marriage increases their taxes. The
concept of marriage neutrality may violate principles of
equity, however, if marriage (or divorce) either in-
creases or decreases couples' combined ability to pay.
If, for example, marriage enables couples to reduce
their housing costs because they live together, marriage
would increase their ability to pay, and in fact some
standards of equity would dictate that they pay higher
taxes than they did before they married.
Progressive Taxation
The principle of progressive taxation holds that taxpay-
ers who have higher incomes should pay a larger per-
centage of their incomes in taxes than do those with
lower incomes. The federal income tax, for example,
imposes no tax on families and individuals who have
the lowest incomes, and taxes income above various
thresholds according to a series of graduated rates rang-
ing from 15 percent to 39.6 percent. Graduated tax
rates, however, are not necessary to achieve progres-
sivity. Combining a single rate and a low-income de-
duction or credit would also be progressive.
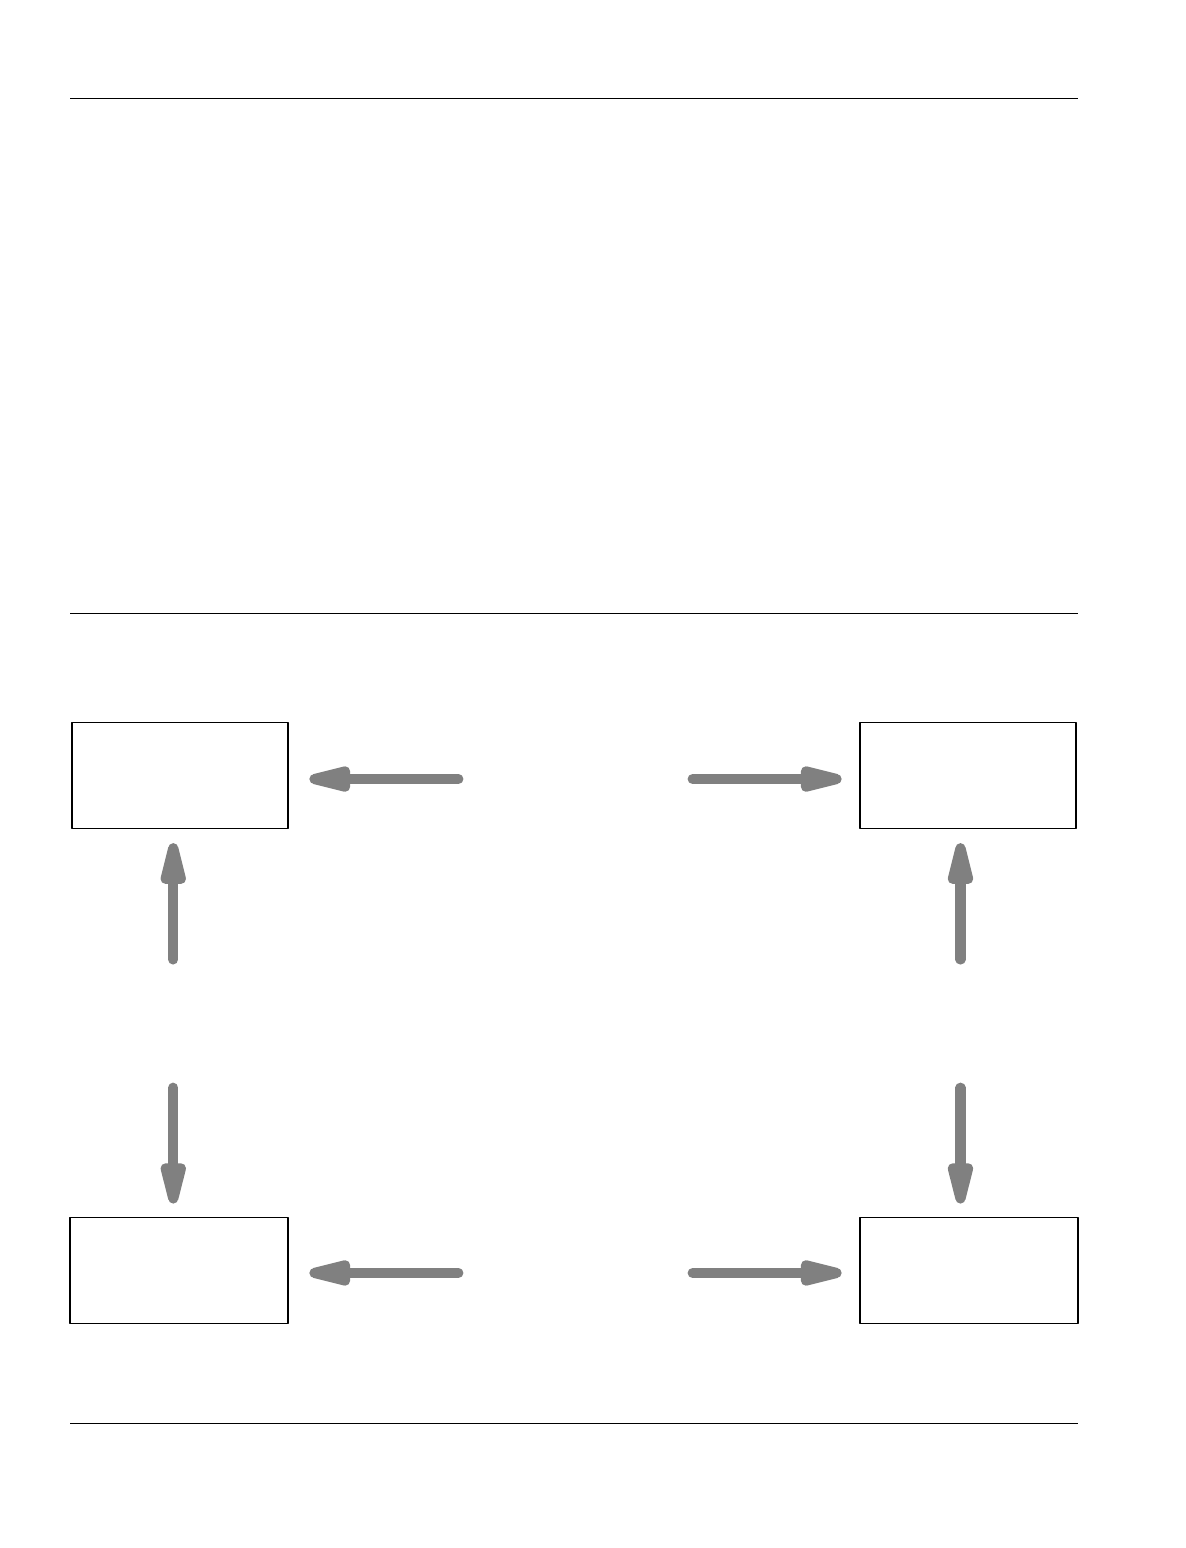
Couple A: married
with both spouses
earning $30,000
Same Tax
(Marriage Neutrality)
Same Tax
(Marriage Neutrality)
Same Tax
(Equal Treatment
of Married Couples)
Different Taxes
(Progressivity)
Couple A: not married,
each person
earning $30,000
Couple B: married
with one worker
earning $60,000
Couple B: not married,
one worker
earning $60,000
CHAPTER ONE MARRIAGE PENALTIES AND BONUSES 3
The Unattainable Ideal
A simple example demonstrates the impossibility of
simultaneously achieving all three of those goals (see
Figure 1). Consider two couples, each earning $60,000
and having no unearned income. Both members of cou-
ple A work, each earning $30,000, whereas only one
member of couple B works, earning the couple's entire
$60,000. Satisfying the goal of taxing married couples
with the same incomes equally requires that married
couple A and married couple B pay the same taxes. To
meet the goal of marriage neutrality, the tax bill of each
couple must not depend on their marital status; that is,
the tax on two single people, each earning $30,000,
must equal the tax on a married couple in which each
spouse earns $30,000, and the tax on two single people,
one with a $60,000 income and the other with no in-
come, must equal the tax on a one-earner married cou-
ple with the same $60,000 income.
Combining the two goals implies that two single
people, each with a $30,000 income, pay the same total
tax as two single people, one earning $60,000 and the
other with no income, or, equivalently, that a single per-
son with a $60,000 income pay exactly double the tax
of a single person earning $30,000. But that outcome
directly violates the goal of progressive taxation: under
that principle, a person who has twice the income of
another pays more than twice the taxes.
Relaxing one or more of the three goals solves the
contradiction among them. Forgoing progressivity, for
example, would allow a tax system to satisfy both the
goal of marriage neutrality and that of equal treatment
Figure 1.
The Conflict Among Goals of Income Taxation
SOURCE: Congressional Budget Office, derived from Treasury Department, Office of Tax Analysis,
Federal Income Tax Treatment of Married and
Single Taxpayers
(September 13, 1977), p. 2.

4 FOR BETTR OR FOR WORSE: MARRIAGE AND THE FEDERAL INCOME TAX June 1997
Box 1.
A Marriage Penalty
A couple with $75,000 in total earnings, split evenly
between the husband and the wife, would have incurred
a marriage penalty of nearly $1,400 under 1996 tax law.
The penalty results from two factors. First, the com-
bined standard deduction for two individual tax filers
would have been $8,000
$1,300 more than the stan-
dard deduction available on a joint return. At the cou-
ple's marginal tax rate of 28 percent, the lower deduc-
tion would have increased the couple's tax liability by
$364 (28 percent of $1,300). Second, because tax
brackets for joint returns were less than twice as wide as
those for individual returns, $7,900 that is taxed at 15
percent on individual returns would have incurred a 28
percent rate on a joint return. That higher tax rate
would have raised the couple's tax liability by an addi-
tional $1,027 (28 percent minus 15 percent equals 13
percent of $7,900). In combination, the two factors
would have increased the couple's tax liability by 1.9
percent of their adjusted gross income.
Husband
Wife Couple
Adjusted Gross Income $37,500 $37,500 $75,000
Less personal exemptions 2,550 2,550 5,100
Less standard deduction 4,000 4,000 6,700
Equals taxable income 30,950 30,950 63,200
Taxable at 15 percent 24,000 24,000 40,100
Taxable at 28 percent 6,950 6,950 23,100
Tax Liability 5,546 5,546 12,483
Marriage Penalty $1,391
As a Percentage of Adjusted Gross Income 1.9
SOURCE: Congressional Budget Office.
of married couples. Alternatively, married couples with
equal incomes but unequal division of income between
spouses could pay different taxes based on the principle
that the division of income within couples measures
different abilities to pay. Or, as in the United States,
the taxes of a married couple could depend only on their
total income, thus satisfying the goal of equal treatment
of married couples but sacrificing the goal of marriage
neutrality because some married couples would pay
higher or lower taxes than they would if they were sin-
gle. In practice, the last solution to the contradiction
among the three goals can impose a marriage penalty
(that is, higher taxes than if they were not married) on
some couples while granting a marriage bonus (lower
taxes) to others. Two examples based on the federal
individual income tax demonstrate these possibilities.
Example: A Marriage Penalty
. A married couple
with $75,000 in earnings, split evenly between husband
and wife, paid $1,391 more in federal individual in-
come taxes in 1996 than they would have if they had
not been married (see Box 1). Two factors contribute
to that marriage penalty. First, when filing a joint tax
return, the couple can claim a standard deduction that is
$1,300 less than the two single standard deductions
$4,000 each they would receive if they were not mar-
ried. At a marginal tax rate of 28 percent, the smaller
deduction costs them $364 (28 percent of $1,300) in
additional taxes. Second, because tax brackets for mar-
ried couples are not twice as wide as those for single
tax filers, $7,900 that is taxed at 15 percent on the two
single returns faces a 28 percent rate on the joint return,
yielding an additional tax of $1,027 (28 percent minus

CHAPTER ONE MARRIAGE PENALTIES AND BONUSES 5
Box 2.
A Marriage Bonus
A couple with $75,000 in total earnings, all earned by
the wife, would have received a marriage bonus of
nearly $4,000 under 1996 tax law. The bonus results
from three factors. First, filing jointly, the couple would
have claimed $5,100 in personal exemptions, twice
what they could have claimed on two single returns. At
a 31 percent tax rate, the larger exemption would have
reduced the couple's tax liability by $791 (31 percent of
$2,550). Second, the standard deduction of $6,700 on a
joint return would have been $2,700 more than the
$4,000 standard deduction the wife could have claimed
on an individual return. (The husband, filing individu-
ally with no income, could not take the deduction.) At
the couple's marginal tax rate of 31 percent, the larger
deduction would have reduced the couple's tax liability
by $837 (31 percent of $2,700). Finally, because tax
brackets for joint returns were wider than those for indi-
vidual returns, $16,100 that is taxed at 28 percent on
individual returns would have been taxed at only 15 per-
cent on a joint return and $5,050 taxed at 31 percent
rather than at 28 percent. Those lower tax rates would
have reduced the couple's tax liability by an additional
$2,245 (28 percent minus 15 percent equals 13 percent
of $16,100 plus 31 percent minus 28 percent equals 3
percent of $5,050). In combination, the three factors
would have lowered the couple's tax liability by 5.2 per-
cent of their adjusted gross income.
Husband
Wife Couple
Adjusted Gross Income $0 $75,000 $75,000
Less personal exemptions 2,550 2,550 5,100
Less standard deduction 4,000 4,000 6,700
Equals taxable income 0 68,450 63,200
Taxable at 15 percent 0 24,000 40,100
Taxable at 28 percent 0 34,150 23,100
Taxable at 31 percent 0 10,300 0
Tax Liability 0 16,355 12,483
Marriage Bonus $3,872
As a Percentage of Adjusted Gross Income 5.2
SOURCE: Congressional Budget Office.
15 percent equals 13 percent of $7,900). In combina-
tion, the two factors generate a marriage penalty of
$1,391 in higher taxes. Because the couple receives the
full value of personal exemptions whether or not they
are married, exemptions cannot contribute to their mar-
riage penalty.
Example: A Marriage Bonus
. The couple described
in the preceding example would have received a mar-
riage bonus of more than $3,500 in 1996 if all of the
couple's income were earned by one spouse
the wife in
this instance (see Box 2). Three factors generate the
bonus. First, because the husband has no earnings, he
would receive no benefit from the personal exemption
when filing as a single person. Filing jointly, the couple
thus receives an additional $2,550 exemption, worth
$791 in lower taxes (31 percent of $2,550). Second,
the married couple can claim a standard deduction that
is $2,700 greater than that which they can claim as sin-
gle filers
again because the husband, without earnings,
receives no value from the deduction as a single filer.
The additional standard deduction lowers the couple's

6 FOR BETTR OR FOR WORSE: MARRIAGE AND THE FEDERAL INCOME TAX June 1997
taxes by $837 (31 percent of $2,700). Finally, because
tax brackets for joint filers are wider than those for sin-
gle people, $16,100 more of the couple's income is
taxed at 15 percent rather than 28 percent, yielding tax
savings of $2,093 (28 percent minus 15 percent equals
13 percent of $16,100), and $5,050 is taxed at 28 per-
cent rather than 31 percent, saving another $152 (31
percent minus 28 percent equals 3 percent of $5,050).
The three factors combine to provide the couple with a
marriage bonus of $3,872 in lower taxes.
A Histor
y
of the Treatment
of Married Cou
p
les in the
Federal Income Tax
Since its inception in 1913, the federal individual in-
come tax has been periodically adjusted in its treatment
of married couples. Until 1948, the government for-
mally imposed income taxes on individuals, but couples
were allowed to file joint returns as early as 1918, even
though joint returns used the same schedules as individ-
ual returns. Individual taxation meant that marital sta-
2
tus had no effect on taxes and, as a result, married cou-
ples with identical total incomes could pay quite differ-
ent taxes, depending on the division of income between
husband and wife.
Community Property Laws
Community property laws in some states complicated
the situation by requiring that husbands and wives
share all of their income equally. The laws therefore
provided a basis for each spouse to pay federal income
taxes on one-half of the couple's income. That claim
equalized taxes for couples with the same income, but
created a situation in which some couples
those in
which husband and wife had different earnings re-
ceived a marriage bonus, paying lower taxes after mar-
riage than before. In 1930, the Supreme Court vali-
dated the splitting of income in community property
states [
Poe v. Seaborn
, 282 U.S. 101 (1930)], but de-
nied that opportunity to couples in other states, even if
they agreed by contract to share their incomes equally
[
Lucas v. Earl
, 281 U.S. 111 (1930)].
The distinction drawn between couples in states
that have community property laws and those that have
common property laws meant that couples with identi-
cal incomes could pay higher federal taxes in the latter
states than in the former. Because only a small fraction
of the population paid any income taxes before World
War II fewer than 4 million people owed any tax in
1939 the Congress felt little pressure to change this
situation during the 1930s. In fact, before 1948, the
Congress's only effort to change the filing status of cou-
ples came in 1941 in a proposal to require couples to
file joint returns at individual rates. The proposal failed
when opponents objected that the change would raise
the taxes paid by virtually all two-earner couples.
As income taxes increasingly became a means to
finance the war effort in the 1940s between 1939 and
1945, taxable returns increased more than tenfold to
nearly 43 million state governments more widely real-
ized that their citizens would pay lower federal taxes if
the states adopted community property laws. After fail-
ing to satisfy a skeptical Supreme Court with optional
community property laws [
Commissioner v. Harmon
,
323 U.S. 44 (1944)], Oklahoma and Oregon enacted
mandatory community property rules that met the
court's objections, even though couples were allowed to
opt out of their coverage. Other states quickly followed
suit. Concerns about problems that community prop-
erty laws could create in nontax areas brought pressure
on the Congress to act on the issue.
Joint Returns
The Congress responded in 1948 by allowing all mar-
ried couples to file joint returns and pay taxes on their
total income using schedules that had brackets twice the
width of those for single individuals. That approach
effectively assigned each spouse one-half of the cou-
2. This history of the treatment of couples in the federal individual in-
come tax draws from Boris I. Bittker, "Federal Income Taxation and
the Family,"
Stanford Law Review
, vol. 27 (July 1975), pp. 1389-
1463; June O'Neill, "Family Issues in Taxation," Rudy Penner, ed.,
Taxing the Family
(Washington, D.C.: American Enterprise Institute,
1983), pp. 1-22; Edward J. McCaffery, "Taxation and the Family: A
Fresh Look at Behavioral Gender Biases in the Code,"
UCLA Law
Review
, vol. 40 (April 1993), pp. 983-1060; Harvey S. Rosen, "The
Marriage Tax Is Down But Not Out,"
National Tax Journal
, vol. XL,
no. 4 (December 1987), pp. 567-575; and Gregg A. Esenwein,
Mar-
riage Tax Penalties and Bonuses Under the Federal Income Tax
,
CRS Report for Congress 93-475E (Congressional Research Service,
May 7, 1993).

CHAPTER ONE MARRIAGE PENALTIES AND BONUSES 7
ple's income and meant that a couple paid taxes equal
to twice what a single person would pay if he earned
one-half of the couple's total income. As a result, a sin-
gle taxpayer would pay higher taxes than a married
couple with the same total income. In effect, the new
law provided a marriage bonus for most couples, and
eliminated neutrality of tax laws with respect to mar-
riage. Under the new law, marriage would leave tax
liabilities unchanged only for couples who had no tax
liability or in instances in which husband and wife had
identical earnings.
In 1951, the Congress extended some of the advan-
tage that married taxpayers received from income-split-
ting to unmarried taxpayers supporting dependents by
establishing new schedules for "heads of household."
Taxpayers in this new category incurred tax liability
that was less than that of single taxpayers but greater
than that of married couples with the same total in-
come. The head-of-household filing status reduced
marriage bonuses for couples with children by lowering
the tax liabilities of single parents.
Although creating the joint filing status eliminated
the unequal treatment of married couples in different
states, it created sizable differences in the taxes paid by
single and married people. Predictably, unmarried peo-
ple viewed those differences as a tax on singles rather
than as a bonus for couples, an effect magnified by the
high marginal tax rates paid by upper-income taxpay-
ers. Under 1970 rates, for example, a single person
earning $20,000 paid $5,328 in income taxes, 42 per-
cent more than the $3,750 paid by a married couple
with the same total income. (About 15 percent of the
difference resulted from the two personal exemptions
allowed the married couple, whereas the single taxpayer
was allowed only one. The rest of the difference de-
rived from higher tax rates for single taxpayers.)
The Tax Reform Act of 1969 partially remedied the
disparity by limiting the tax liability of single people to
no more than 20 percent above that of married couples
with the same taxable income, effective for tax years
after 1970. For example, the change reduced the dis-
parity in taxes between a single taxpayer and a married
couple, each with $20,000 in total income, from 42 per-
cent to 24 percent. But the limitation created marriage
penalties for couples in which husband and wife had
similar incomes and left in place marriage bonuses
when the earnings split between spouses was less equal.
The Earned Income Tax Credit
The Tax Reform Act of 1975 created the Earned In-
come Tax Credit (EITC), a refundable credit available
to low-income taxpayers with earnings. Because indi-
vidual and joint filers have the same restrictions on
their incomes for receiving the credit, the EITC added a
potential penalty on married couples. If a low-income
person who qualified for the EITC got married, the
combined income of the couple could make them ineli-
gible for the credit. At the same time, the requirement
that credit claimants have a dependent child meant that
couples could receive a tax bonus if a low-earner mar-
ried a single parent with no earnings. The magnitude of
both marriage penalties and bonuses resulting from the
EITC was increased by subsequent tax acts that created
different credits for taxpayers with one and more than
one child, raised the maximum value of the credit, and
extended eligibility to childless families.
Recent Changes in Tax Law
Complaints from two-earner couples about the "mar-
riage tax" they had to pay led the Congress to reduce
the taxes for those couples as part of the Economic Re-
covery Tax Act of 1981. That act established a two-
earner deduction equal to 10 percent of the earnings of
the lower-earning spouse, up to a maximum deduction
of $3,000. The deduction reduced the marriage penalty
for all couples facing the penalty, and eliminated the
penalty entirely for some, but increased the size of the
marriage bonus for others. Even with the new deduc-
tion, however, some couples paid more than $4,000 in
added taxes because they filed joint returns.
The Tax Reform Act of 1986 repealed the two-
earner deduction as part of a broad reform that in-
creased the standard deduction for married couples and
collapsed the tax schedule from 15 brackets with a
maximum rate of 50 percent to just two brackets with a
maximum rate of 28 percent. (Married couples with
taxable income between $71,900 and $149,250 faced
tax rates of 33 percent as the act phased out the bene-
fits of the 15 percent bracket over that income range.
The 33 percent rate was further extended up to tax-
able income of $192,930 for a family of four by phas-
ing out the benefits from personal exemptions.) In
combination, those changes sharply reduced the mar-
riage penalty. For example, the act cut the marriage

8 FOR BETTR OR FOR WORSE: MARRIAGE AND THE FEDERAL INCOME TAX June 1997
penalty for a couple in which the husband and wife each
earned $50,000 by more than one-half in 1988, from
$2,609 to $1,284. Although the act did not eliminate
3
marriage penalties and bonuses, it reduced them enough
to quiet most critics.
Tax increases in 1990 and 1993 expanded the num-
ber of tax brackets from two to five, raised the maxi-
mum marginal tax rate to 39.6 percent, and sharply in-
creased the size and coverage of the earned income tax
credit. In combination, those changes imposed signifi-
cantly larger marriage penalties on both low- and high-
income families, and increased the size of the marriage
bonus for some couples. For example, a childless cou-
ple in which husband and wife each earned $300,000
faced a marriage penalty of nearly $16,000 after the
1993 act, compared with a penalty of about $1,900 un-
der the old law. At the other end of the income scale, a
4
one-earner couple with two children and earnings of
$10,000 saw their marriage penalty of $161 turn into a
bonus of nearly $500.
Those increases in the disparity between the taxes
paid by married couples and their unmarried counter-
parts have revived interest in reducing the effects of
marriage on tax liability. The "Contract with America
Tax Relief Act of 1995," as passed by the House of
Representatives, would have reduced marriage penalties
slightly by giving tax credits to couples incurring penal-
ties. To constrain the revenue losses from the provi-
sion, the act would have limited credits to $145. Given
that the penalty, under one broad measure, averages
nearly $1,400 for couples who incur it and can exceed
$20,000 for high-income couples, the credit would have
done little to offset the tax costs of marriage. The Sen-
ate in 1995 considered a proposal to set the standard
deduction for joint filers equal to twice that for single
filers. The change would have been phased in over a
10-year period. That proposal would have reduced or
eliminated penalties for taxpayers who do not itemize
their deductions. At the same time, it would have in-
creased bonuses for many couples and had no effect on
penalties for couples who continued to itemize deduc-
tions. The Balanced Budget Act of 1995, which in-
cluded the Senate provision, was vetoed by President
Clinton.
The United States is among a minority of devel-
oped nations that tax married couples. More than two-
thirds of the countries that are members of the Organi-
zation for Economic Cooperation and Development
(OECD) tax married couples as individuals. Only three
other developed countries tax couples jointly as does
the United States, and four others tax all family mem-
bers as a single entity (see Appendix A). Furthermore,
the trend has been moving away from joint taxation:
over the last two decades, 10 OECD members switched
from joint to individual taxation of married couples.
During the same period, no member country changed in
the other direction.
States vary more widely in taxing the incomes of
married couples (see Appendix B). Of the 42 states
that tax incomes, only 12 tax couples in ways that gen-
erate significant marriage penalties. Another 15 states
tax couples jointly, but use rate schedules that substan-
tially reduce or eliminate penalties. Nine states and the
District of Columbia allow couples to file individually
on a single return, thus providing them with tax savings
available to unmarried taxpayers. Finally, six states
impose a single tax rate that, in combination with stan-
dard deductions and exemptions, precludes all marriage
penalties.
The history of the changing taxation of couples and
single people demonstrates the tension between impos-
ing higher taxes on one group or the other with a pro-
gressive rate structure. Taxing individuals, as was the
case when the income tax began, avoids the problem of
different taxes based on marital status but runs afoul of
the principle of taxing married couples equally and of
state community property laws. The 1948 "solution" of
joint taxation dealt with both of those problems but
necessarily imposed higher taxes on single people in
relation to married couples, thus violating the principle
of marriage neutrality. The last five decades have wit-
nessed periodic movements between those two poles,
depending on the demands for fairness toward singles
or couples. As long as the Congress pursues the three
mutually incompatible goals of marriage neutrality,
equal treatment of couples with similar incomes, and
progressive tax rates, the tension between the two posi-
tions will continue.
3. Joint Committee on Taxation,
General Explanation of the Tax Re-
form Act of 1986
, Joint Committee Print JCS-10-87 (May 4, 1987),
p. 19.
4. Daniel R. Feenberg and Harvey S. Rosen, "Recent Developments in
the Marriage Tax,"
National Tax Journal
, vol. 47, no. 1 (March
1995), p. 94.

CHAPTER ONE MARRIAGE PENALTIES AND BONUSES 9
The Si
g
nificance of Marria
g
e
Penalties and Bonuses
Does it matter that marriage penalties and bonuses arise
from a tax code designed to meet the goals of equal tax
liabilities for married couples with the same incomes
and progressive taxation? Three issues are paramount
in answering that question: the fairness of tax levies
among couples, the effects of taxes on how much peo-
ple choose to work, and the effects of taxes on marriage
and divorce.
Fairness
Equal treatment under the law is a basic concept of fair-
ness. Horizontal equity in taxation stipulates that peo-
ple who have equal ability to pay receive equal treat-
ment and therefore bear the same tax burden. Al-
though determining ability to pay may be difficult in
practice, the concept of horizontal equity helps in eval-
uating the conflicting goals of the tax system that lead
to marriage penalties and bonuses. On the one hand, if
the act of marriage has no effect on a couple's ability to
pay, horizontal equity implies that taxes be marriage
neutral
that is, that couples pay the same taxes
whether or not they are married. On the other hand, if
they are otherwise similar, married couples with the
same total income must pay the same taxes to satisfy
the criterion of equity. In the face of progressive tax
rates, however, the two goals conflict (see "Defining
Marriage Penalties and Bonuses" above). Reconciling
them demands investigation of marriage penalties and
bonuses.
One issue that must precede the question of hori-
zontal equity involves the appropriate unit on which to
levy taxes. If individuals provide their own resources
and do not share with others, the most appropriate unit
would be the individual. If, however, people share re-
sources and consume goods and services in groups,
those groups are the appropriate units for the purpose
of taxation. The federal income tax code assumes that
married couples combine their incomes and other re-
sources to support themselves and their dependents,
and therefore imposes taxes on the joint incomes of
spouses. The code stops short of defining all tax units
on the basis of shared incomes. On the one hand, mar-
ried couples are presumed to combine resources and
thus must file jointly. On the other hand, people in re-
lationships not based on legal marriage or other family
relationships must pay taxes on their separate incomes,
even if they consume together. Unmarried couples or
two members of the same family sharing a home are
taxed as individuals.
Despite the implicit assumptions built into the tax
code, marriage may or may not affect a couple's ability
to pay, depending on whether the couple's costs of liv-
ing change. If the couple lived together before mar-
riage, simply getting married would have little or no
effect on their costs and hence on their ability to pay. If
they create a new household after marriage, their costs
could rise or fall. If, for example, each person lived
with his or her parents before the wedding, marriage
could increase their costs, but if each had maintained a
separate household, combining those households into
one could reduce costs. Because living arrangements
before and after marriage need not differ, the tax sys-
tem might logically assume that marriage has no intrin-
sic effect on a couple's ability to pay and therefore that
marriage neutrality would be desirable. The conclusion
that marriage should not affect a couple's tax bill says
nothing about the fairness of taxation of either married
or unmarried couples.
Whether imposing the same taxes on married cou-
ples with equal incomes satisfies the principle of hori-
zontal equity is more problematic. Two childless cou-
ples who have the same total income, earned in each
case by two full-time workers, may also have the same
ability to pay, regardless of the division of income be-
tween spouses. If one couple had only one worker,
however, the couples would have quite different abili-
ties to pay because the nonworking spouse could pro-
vide services in kind that are not as readily available to
the two-earner couple. But if the working spouse of the
one-earner couple held two different jobs, the couple's
ability to pay would be different yet. In essence, as is
more generally true, income alone provides a poor mea-
sure of ability to pay. Requiring that married couples
with a given amount of total income pay the same taxes
may therefore not satisfy the principle of horizontal
equity.
Children complicate the issue. Tax rules can be
totally indifferent to the presence of children, treating
the decision to have and rear children as entirely the

10 FOR BETTR OR FOR WORSE: MARRIAGE AND THE FEDERAL INCOME TAX June 1997
responsibility of the parents. If, however, society val-
ues children and chooses to subsidize parents who rear
them, tax rules, as in the current tax code, may be used
to provide tax relief to families with children. Further-
more, the government may wish to encourage couples
to have children by not taxing any resources that are
provided by parents who stay home to care for them.
Under that assumption, equal taxation of one- and two-
earner couples who have the same total incomes may be
appropriate.
The movement of people through a variety of tax
statuses during their lifetimes and their consequent lia-
bility for different amounts of tax over time further
complicate issues of fairness. A couple may change
from being two unmarried individuals with earnings, to
a two-earner childless married couple, to a one-earner
couple with one spouse caring for children, to a two-
earner couple purchasing child care, to a two-earner
couple with older children who can care for themselves,
and back to a two-earner childless couple. The individ-
ual income tax would treat the couple differently in
each period, whether or not their ability to pay changes.
Depending on the division of earnings between spouses,
the couple may pay higher or lower taxes because they
are married, even if they experience no change in ability
to pay. The various features of the tax code affect peo-
ple differently throughout their lives, sometimes reduc-
ing their tax liability and other times increasing it. As-
sessing whether they are taxed fairly depends on
whether their situation is considered in any given year
or over their entire lifetime as a couple. What may ap-
pear to be unfair in one year may appear quite different
when viewed in a lifetime context.
The conflict between the two goals of marriage
neutrality and taxing couples with equal incomes the
same would matter little if the marital penalties and
bonuses generated were small. To determine the impor-
tance of those effects in terms of both their size and
the number of couples affected requires a close exami-
nation of who pays the penalties and who receives the
bonuses.
Effects on the Supply of Labor
Taxing married couples may significantly affect the
amount of paid work done by the second worker in each
couple because a husband's and wife's incomes are
combined to determine tax liability. For example, if a
5
man earns $75,000 and his wife decides to take a job,
the couple will pay 28 percent of the wife's earnings to
the federal government as income taxes, a further 15.3
percent in Social Security taxes (counting both em-
ployer and employee shares), and, possibly, a state or
local income tax. Because the husband's income has
6
already moved the couple into the 28 percent income
tax bracket, the first dollar of the wife's income bears a
total tax rate greater than 43 percent. If she was single,
the wife would pay no income tax on the first $6,550
that she earned and only a 15 percent income tax on the
next $24,000. Including the 15.3 percent Social Secu-
rity payroll tax, her marginal tax rate would be either
15.3 percent or 30.3 percent (not counting any state or
local taxes), 28 percentage points or 13 percentage
points lower than the 43.3 percent rate she incurs as a
married person. The higher initial tax rate she faces
when married reduces the value of her work and thus
may induce her to work fewer hours each week, fewer
weeks each year, or even not to work at all. At the
same time, the husband's income may be taxed at a
lower marginal rate than it would be if he was not mar-
ried, yielding a higher after-tax wage that might lead
him to work more than he otherwise would choose to
do. If he was single, the husband would face a marginal
income tax rate of 31 percent, higher than the 28 per-
cent rate he faces when married. However, his average
tax rate is also lower in marriage, raising his after-tax
income and thus encouraging him to work less. The net
effect on his labor supply is uncertain.
Taxes exert two countervailing influences on an
individual's decision about how much to work. Com-
pared with a situation in which there are no taxes on
earnings, a tax reduces both the after-tax hourly wage
of workers and their total after-tax income. Because
people will choose to work more hours as long as their
net hourly wage exceeds their value of an extra hour of
leisure, the tax's lowering of net wages will lead indi-
viduals to work fewer hours. At the same time, because
people's income falls at any number of hours worked
5. For further detail on the effects of taxes on the work patterns of men
and women, see Congressional Budget Office,
Labor Supply and
Taxes
, CBO Memorandum (January 1996).
6. Most economists believe that the couple bears the employer's share of
the payroll tax on the wife's earnings in the form of wages that are
lower than they would otherwise be. That tax thus affects after-tax
wages, the basis on which the wife may decide whether to go to work.

CHAPTER ONE MARRIAGE PENALTIES AND BONUSES 11
as a result of the tax, they will want to consume less
leisure and work more hours. The net effect depends on
the relative magnitudes of the two offsetting pressures.
Economists refer to those influences as the substitution
effect and the income effect, respectively.
Research into the sensitivity of people's labor sup-
ply to their after-tax wages offers a mixed picture of
how higher marginal tax rates on married couples affect
their decisions about whether and how much to work.
Economist James Heckman emphasized the need to
distinguish between the effects of increased net wages
on the hours worked by people already employed and
the decision by people not working to take a job. Rob-
7
ert Triest found that the decisions of both husbands and
wives about the number of hours worked depend little
on after-tax wages once the individual has decided to
work at all. But the decision to work appears to be
8
much more responsive to changes in net wages, and
more so for wives than for husbands. Studies of these
issues encounter a range of methodological and mea-
surement problems, however, and the magnitude of the
effects is uncertain.
9
Some workers appear to react more strongly to
changes in their net wages than others. Economists
Chinhui Juhn, Kevin Murphy, and Robert Topel found,
for example, that low-wage workers are much more
sensitive to their net pay than are higher-wage work-
ers. Their data suggest that a 10 percent increase in
10
after-tax wages would lead workers in the bottom one-
fifth of the wage distribution to increase the hours they
worked by about 2.5 percent, and that those in the top
two-fifths would work only about 0.5 percent more. By
contrast, at the top end of the income scale, economist
Nada Eissa found evidence that the labor supply of
wives in upper-income families is highly sensitive to
after-tax wages. Her analysis suggested that wives in
11
the top 1 percent of income distribution would increase
the hours they worked by 8 percent in response to a 10
percent increase in net wages. Neither of those results,
however, applies to married couples as a group, and
studies that have attempted to measure the magnitude
of the effects of wages on work have identified a wide
range of values.
An international comparison of the labor supply of
wives under joint and individual taxation indicates that
joint taxation reduces the participation of women in the
labor force. Economist Siv Gustafsson compared the
labor supply among married women under Germany's
joint and Sweden's individual income tax systems.
12
She estimated that imposing the German joint taxation
approach on Sweden would have caused the participa-
tion rate of Swedish wives in the labor force to fall by
one-fourth, whereas subjecting German wives to a
Swedish-style tax system would have raised the parti-
cipation rate of married German women in the labor
force by one-fifth. That conclusion was bolstered by
Gustafsson's finding that participation of Swedish
wives in the labor force rose markedly following the
replacement of joint with individual taxation in 1971.
Although other factors surely contributed to the in-
crease, and although the rise occurred gradually over a
number of years as families adapted to the new tax sys-
tem, the rate of participation of married women in the
Swedish labor force climbed from 53 percent in 1969 to
74 percent a decade later. By comparison, Germany,
which had joint taxation throughout the period, experi-
enced one-third the increase of Sweden, from 39 per-
cent to 46 percent.
Filing a joint tax return in the United States can
result in higher, lower, or unchanged marginal tax rates
for both husband and wife, depending on their total in-
7. James J. Heckman, "What Has Been Learned About Labor Supply in
the Past Twenty Years?"
American Economic Review Papers and
Proceedings
, vol. 83, no. 2 (May 1993), pp. 116-121.
8. Robert K. Triest, "The Effect of Income Taxation on Labor Supply in
the United States,"
The Journal of Human Resources
, vol. XXV, no.
3 (1990), pp. 491-516.
9. Randolph and Rogers discuss these issues and the reasons they are
unsettled in William C. Randolph and Diane Lim Rogers, "The Impli-
cations for Tax Policy of Uncertainty About Labor Supply and Sav-
ings Responses,"
National Tax Journal
, vol. 48, no. 3 (September
1995), pp. 429-446.
10. Chinhui Juhn, Kevin M. Murphy, and Robert H. Topel, "Why Has the
Natural Rate of Unemployment Increased Over Time?"
Brookings
Papers on Economic Activity
, no. 2 (1991), pp. 75-126. In the same
publication, however, Janet Yellen countered that their estimates were
too high because they failed to account for changes in government
transfer programs (pp. 127-133).
11. Nada Eissa,
Taxation and Labor Supply of Married Women: The
Tax Reform Act of 1986 As a Natural Experiment
, Working Paper
No. 5023 (Cambridge, Mass.: National Bureau of Economic Re-
search, February 1995). Eissa found that about one-half of the rise
resulted from nonworking wives entering the labor force and one-half
from employed wives working longer hours.
12. Siv Gustafsson, "Separate Taxation and Married Women's Labor Sup-
ply: A Comparison of West Germany and Sweden,"
Journal of Popu-
lation Economics
, vol. 5, no. 1 (February 1992), pp. 61-85.

12 FOR BETTR OR FOR WORSE: MARRIAGE AND THE FEDERAL INCOME TAX June 1997
Table 1.
Effects on Marginal Tax Rates of Married Couples Filing Jointly Rather than Individually,
Projected 1996 (In percentage of married couples)
Marginal Tax Rate
of Spouse with Marginal Tax Rate of Spouse with Lower Earnings
Higher Earnings Lower Unchanged Higher All Couples
Lower 3 3 18 24
Unchanged 7 14 43 64
Higher 1
1 11 12
All Couples 11 17 72 100
SOURCE: Congressional Budget Office simulations.
come and how much is earned by each spouse. Esti-
mates for 1996 suggest that just 14 percent of married
couples filing jointly will face the same marginal tax
rate that each spouse would incur if they could file as
individuals (see Table 1). Filing jointly rather than in-
dividually will lead to reduced marginal tax rates for the
higher-earning spouse in 24 percent of all couples, un-
changed marginal rates in 64 percent, and higher mar-
ginal rates in 12 percent. At the same time, joint versus
individual filing raises marginal tax rates of lower-earn-
ing spouses in 72 percent of couples, lowers rates in 11
percent of couples, and has no effect in 17 percent.
The Congressional Budget Office (CBO) used
microeconomic simulations to estimate the effects of
requiring joint filing on the work behavior of husbands
and wives. Using values for substitution and income
elasticities from the economic literature on labor sup-
ply, CBO estimated how much each husband and wife
would work if they faced individual marginal tax rates
based on their own incomes rather than the rates that
apply when they file joint tax returns.
13
The simulations indicated that joint tax rates moti-
vate higher-earning spouses to work between 0.1 per-
cent and 0.3 percent
more
than they would if the tax
code required them to file as individuals. That result is
consistent with the observation that joint filing is more
likely to lower tax rates for primary earners than to
raise them. The reverse holds for secondary workers.
Simulations indicated that generally higher tax rates for
lower-earning spouses prompt them to work between 4
percent and 7 percent
less
than they would if they could
file individually. Overall, requiring couples to file joint
tax returns induces them to work less. As a result, their
total earnings are between 0.7 percent and 1.2 percent
less than they would otherwise be.
Effects on Marriage and Divorce
Couples decide to marry or divorce on the basis of the
trade-offs between a broad array of benefits and costs
of marriage. Social pressures, the desire for compan-
ionship, love, wanting to rear children, and economic
considerations may induce people to marry, whereas
issues of privacy and psychological and monetary costs
may keep couples from marrying or induce them to seek
divorce. The tax costs or benefits of marriage are of
highly uncertain but almost surely slight impor-
tance. For most couples, other factors almost cer-
14
tainly dominate tax considerations in the marriage deci-
13. Elasticities used for estimates of labor supply response were taken
from Congressional Budget Office,
Labor Supply and Taxes
. The
ranges used were primary worker substitution elasticity, 0.1 to 0.2;
primary worker income elasticity, 0 to -0.1; secondary worker substi-
tution elasticity, 0.6 to 0.9; and secondary worker income elasticity,
-0.2 to -0.3.
14. The potential loss of means-tested benefits that many low-income
mothers receive may be much more important. If marriage disqualifies
a family for food stamps, housing assistance, and Medicaid benefits,
the dollar cost is substantial. Especially in communities in which un-
married mothers are common, those costs could well outweigh other
factors and generate significant disincentives to marry.

CHAPTER ONE MARRIAGE PENALTIES AND BONUSES 13
sion, as evidenced by the substantial numbers of cou-
ples who bear large marriage penalties in the form of
higher taxes. Even so, couples for whom the decision
to marry is close that is, at the economist's margin,
where minor factors can carry the day may decide that
being married is not worth having to pay thousands of
dollars of additional taxes every year. Other couples
may face bonuses that provide just enough additional
inducement to lead them down the aisle. Similar issues
may enter into couples' decisions to divorce.
15
Economists investigating the impact of tax penal-
ties on marriage have found only small or no effects.
One study, for example, found that a 10 percent in-
crease in all marriage penalties would decrease the frac-
tion of adult women under 45 years old who are married
by less than 0.5 percent. Another study, focusing on
16
the likelihood of single adult women marrying in a
given year, detected no marriage penalty effect, but did
find indications that some couples appeared to delay
marriages for a few months to avoid paying higher
taxes for a single year.
17
One test of the effects of marriage penalties on
whether couples wed is to compare the bonuses and
penalties for married couples with those that unmarried
couples would incur if they were to marry. Such a com-
parison, based on data from the March 1996 Current
Population Survey, indicates that unmarried couples
would be more likely than married couples to incur pen-
alties if they were married, although only marginally so
Table 2.
Marriage Penalties and Bonuses for Married
and Unmarried Couples, Simulated 1995
Married Unmarried
Couples Couples
a
Number of Couples (Thousands)
With Penalties 26,800 1,500
Unaffected 6,400 300
With Bonuses 21,500
900
Total 54,700 2,700
Couples in Category (Percent)
With Penalties 49 56
Unaffected 12 11
With Bonuses 39
33
Total 100 100
Average Penalty
In Dollars 1,200 770
As a Percentage of Income 1.9 1.6
Average Bonus
In Dollars 1,140 1,020
As a Percentage of Income 2.3 2.7
SOURCE: Congressional Budget Office simulations based on data
from the March 1996 Current Population Survey.
a. Unmarried couples are those living together and reporting as part-
ners.
(see Table 2). In 1995, 56 percent of unmarried cou-
18
ples would have incurred penalties if they had been
married, compared with 49 percent of married couples.
Respective values for marriage bonuses would have
been 33 percent and 39 percent.
The foregoing comparisons might suggest that
some couples may elect not to marry if doing so would
bring them tax penalties. However, average penalties
for married couples are much greater than the hypothet-
15. Leslie Whittington and James Alm found small effects of income taxes
on decisions to divorce, particularly for women. Whittington and Alm,
"'Til Death Do Us Part: The Effect of Income Taxation on Divorce,"
forthcoming in the
Journal of Human Resources
(Spring 1997).
16. James Alm and Leslie A. Whittington, "Does the Income Tax Affect
Marital Decisions?"
National Tax Journal
, vol. 48, no. 4 (December
1995), pp. 565-572. In more recent work, the authors find small but
statistically significant effects of marriage penalties in reducing the
likelihood of marriage for women but not for men. Alm and
Whittington, "For Love or Money: The Impact of Income-Taxes on
Marriage" (unpublished working paper, University of Colorado at
Boulder, February 1997).
17. David L. Sjoquist and Mary Beth Walker, "The Marriage Tax and the
Rate and Timing of Marriage,"
National Tax Journal
, vol. XLVIII,
no. 4 (December 1995), pp. 547-558. James Alm and Leslie
Whittington also found small but significant effects of penalties delay-
ing marriage. Alm and Whittington, "Income Taxes and the Timing of
Marital Decisions," forthcoming in the
Journal of Public Economics
(1997).
18. Unmarried couples are unmarried adults who identified themselves to
Current Population Survey interviewers as partners. Couples could
be of the same or opposite sexes. Only 3 percent were same-sex cou-
ples. See Appendix C.

14 FOR BETTR OR FOR WORSE: MARRIAGE AND THE FEDERAL INCOME TAX June 1997
ical penalties for unmarried couples would be $1,200
versus $770 although penalties for the two groups
measured as a percentage of income are less diver-
gent 1.9 percent versus 1.6 percent. In part, the dif-
ference may arise from the different characteristics of
the two groups (see Appendix C). Unmarried couples,
with a median age of 35, are younger than their married
counterparts (median age 47) and have a lower median
income: $35,000 versus $45,000. Because their in-
comes are lower, unmarried couples may not be as will-
ing to incur marriage penalties as wealthier couples,
even if those penalties represent a smaller fraction of
their incomes. In addition, younger couples may be less
averse to living together outside of marriage than older
couples and thus may feel less pressure to marry. For
most couples, however, potential marriage penalties
and bonuses are not sufficient cause to alter marriage
decisions.

M
Chapter Two
Sources of Marriage
Penalties and Bonuses
arried couples incur tax penalties or receive
tax bonuses because the tax code treats them
differently from unmarried taxpayers.
Whether a couple has a penalty or a bonus depends on
the level and sources of their income, the division of
income between husband and wife, and the presence or
absence of children. Understanding marriage penalties
and bonuses requires an examination of the factors
within the law that generate differences in the taxes
paid by married and unmarried couples.
Factors Givin
g
Rise to
Marria
g
e Penalties and
Bonuses
Marriage penalties and bonuses result from factors that
affect either the level of taxable income or the tax rate
applied to that income. A penalty or a bonus occurs
whenever a couple's exemptions, deductions, tax brack-
ets, or credits differ from those of two otherwise similar
single people (see Table 3). Such differences occur
because the individual income tax sets parameters in
dollars. Those dollar amounts for married couples of-
ten differ from the sums that would apply to spouses if
they were single.
The various components of the income tax system
interact in determining whether couples incur penalties
or bonuses. They also determine the size of those tax
differentials. Certain parts of the tax system may im-
pose potentially large marriage penalties, but may do so
for relatively few couples. The following analysis ex-
amines only the hypothetical impact of each component
on the taxes married couples pay, without regard to
how many couples each component affects (see Appen-
dix Table D-1).
1
The Standard Deduction
In 1996, single filers could claim a standard deduction
of $4,000, married couples $6,700, and heads of house-
hold $5,900. Most taxpayers claimed the standard de-
duction, presumably because its value exceeded the de-
ductions they could itemize, such as state taxes or home
mortgage interest payments. In 1994, only 28 percent
of all individual tax returns itemized their deductions.
If each can use the full deduction, two single filers
claiming standard deductions could reduce their 1996
taxable income by $8,000 $1,300 more than the
$6,700 deduction for joint filers. Differences in the
standard deduction among filing statuses would thus
impose a marriage penalty on such a couple that is
equal to the tax on that additional taxable income, the
amount of which depends on the couple's marginal tax
1. For a comprehensive discussion of provisions of the federal individual
income tax code that give rise to marriage penalties and bonuses, see
General Accounting Office,
Income Tax Treatment of Married and
Single Individuals
, GAO/GGD-96-175 (September 1996).

16 FOR BETTER OR FOR WORSE: MARRIAGE AND THE FEDERAL INCOME TAX June 1997
Table 3.
Factors Determining Whether Couples Face Marriage Penalties or Bonuses, 1996
Conditions Leading Conditions Leading
Tax Parameter or Feature to Marriage Penalty to Marriage Bonus
Personal Exemptions
($2,550 for all individuals,
regardless of marital status.)
None. One spouse cannot use full sin-
gle exemption but other spouse
would have positive taxable in-
come if taxed as an individual.
Standard Deduction
($4,000 for singles,
$6,700 for couples.)
Combined use of two single
deductions exceeds value of
married deduction.
One spouse cannot use full sin-
gle deduction but other spouse
would have positive taxable in-
come if taxed as an individual.
Tax Brackets
(Lower brackets for singles are
60 percent as wide as those for
couples; top bracket starts at
same income for all.)
Spouses have more nearly equal
incomes; as married couple,
more of combined income taxed
at higher rate; high earners have
more income subject to top tax
rate.
Spouses have unequal incomes;
as singles, income of higher-
earning spouse taxed at higher
rate.
Earned Income Tax Credit
(Parameters same regardless of
filing status.)
Low-earning parent married to
spouse whose income causes
loss of some or all of earned
income tax credit.
Low-earning childless person
married to parent with no or very
low earnings.
Phaseout of Personal
Exemptions (Starting income for
singles equals two-thirds of that
for couples.)
Spouses have more nearly equal
incomes; as married couple,
more of total income falls in
phaseout range.
Spouses have unequal incomes;
as singles, more income of
higher-earning spouse subject to
phaseout.
Limitation on Itemized Deduc-
tions (Starting point same
regardless of filing status.)
Spouses have more nearly equal
incomes; as married couple,
more of total income falls in limi-
tation range.
None.
Other Fixed Dollar Limitations
(For example, income limit for
individual retirement accounts,
thresholds for taxation of Social
Security.)
Either marriage does not in-
crease limit or increase is less
than spouse adds to measure
subject to limit.
Marriage increases limit and one
spouse adds less to measure
subject to limit than the increase
in limit.
SOURCE: Congressional Budget Office.

CHAPTER TWO SOURCES OF MARRIAGE PENALTIES AND BONUSES 17
rate. A couple in the 28 percent tax bracket pays $364
(28 percent of $1,300) more in taxes than two compa-
rable single filers, whereas a couple in the 15 percent
bracket pays $195 more. The standard deduction can-
not create a marriage penalty for couples who itemize
their deductions and would do so even if they were not
married.
The decision to itemize deductions can depend,
however, on whether a couple is married. Consider, for
example, two taxpayers who can each itemize $3,600
worth of deductions if they are not married and file sin-
gly. Because the standard deduction $4,000 exceeds
their itemizable deductions, each would choose to take
the standard deduction and the total value of their de-
ductions would equal $8,000. If they were married,
their total itemized deductions would be $7,200, more
than the standard deduction of $6,700 allowed for joint
returns, and they would elect to itemize their deduc-
tions. Even though they itemize, they incur a marriage
penalty because being married reduces their total de-
ductions by $800. That penalty, however, results not
from itemizing but from the difference in standard de-
ductions for singles and couples.
The effect of standard deductions is greater if either
spouse, were the couple not married, could file as head
of household. The 1996 standard deduction for heads
of household is $5,900, therefore, two heads of house-
hold could claim total deductions of $11,800 $5,100
more than the $6,700 available to joint filers.
The standard deduction can create marriage bo-
nuses for couples in which one spouse has a low income
and cannot use the full value of the standard deduction
as a single filer. That spouse brings to a marriage his
or her unused deduction, which can serve to reduce the
couple's tax liability.
Personal Exemptions
Because their value does not vary by filing status, per-
sonal exemptions cannot contribute to marriage penal-
ties. They can, however, provide marriage bonuses for
spouses who could not use the full value of their ex-
emptions if they were not married and thus had to file
separately. In 1996, for example, the personal exemp-
tion of $2,550 per taxpayer reduced the taxable income
of a one-earner childless couple by $2,550 because they
filed jointly rather than as single individuals. If they
were not married, the nonworker would pay no taxes
with or without the exemption and would therefore re-
ceive no value from it.
Tax Brackets
Because tax brackets for joint tax filers are wider than
those for either single filers or heads of household but
not twice as wide they can generate either marriage
penalties or bonuses, depending on the division of in-
come between husband and wife. Couples in which one
spouse earns most of the income generally receive mar-
riage bonuses because the wider tax brackets for joint
filers impose lower taxes on the income of the higher-
earning spouse than do the narrower brackets for indi-
viduals filing as single or head of household (see Box
3). In 1996, those bonuses exceeded $2,000 for a cou-
ple with $40,100 of taxable income and nearly $4,600
for couples with taxable income of $147,700 or more.
Couples in which husband and wife earn more
nearly equal shares of total income generally incur mar-
riage penalties because the joint tax brackets are less
than twice the width of single brackets (see Box 4). In
1996, married couples with an equally divided taxable
income of $48,000 paid about $1,000 more in taxes
than they would have if they had not filed joint returns.
The penalty rises to just over $1,600 for couples with a
taxable income of $116,300. Two-earner couples who
have very high and equal incomes pay the largest mar-
riage penalties, since the top rate bracket begins at the
same level of taxable income for all filing statuses
$263,750 in 1996. As a result, as much as $263,750 of
joint income can be taxed at 39.6 percent rather than 36
percent, raising a couple's taxes by a maximum of al-
most $9,500 more.
The Earned Income Tax Credit
Couples who have low earnings may incur a marriage
penalty or bonus because the size of the earned income
tax credit does not depend on a family's filing status but
does vary with the number of children in the family. As
a result, combining the incomes and children of both
spouses on one return can increase or reduce the credit

As a Percentage of
Taxable Income
(Right scale)
Marriage
Bonus
(Dollars)
Marriage
Bonus
(As a
percentage
of taxable
income)
Taxable Income (Dollars)
24,000
40,100
58,150
96,900
121,300
147,700
263,750 600,000
Filing Individually
Filing Jointly
Tax Brackets and Rates (In percent)
15 28
39.615 28
31
31
36
36
39.6
0
5,000
10,000
15,000
0
1
2
3
4
5
6
5 Percentage
Point
Differential
3 Percentage
Point
Differential
Dollars
(Left scale)
13 Percentage
Point
Differential
18 FOR BETTER OR FOR WORSE: MARRIAGE AND THE FEDERAL INCOME TAX June 1997
Box 3.
1996 Marriage Bonuses Resulting from Tax Brackets for One-Earner Couples
Tax brackets create marriage bonuses when the mar-
ginal tax rate of an individual return exceeds that for a
joint return with the same taxable income. For example,
when a couple's taxable income is between $24,000 and
$40,100, all earned by one spouse, the marginal tax rate
that is, the tax rate on the last dollar of income on a
joint return is 15 percent, whereas that on an individual
return is 28 percent. The 13 percentage point differen-
tial yields a marriage bonus of 13 cents for each dollar
of taxable income in that range, over which the bonus,
measured in dollars, rises from zero to $2,093 (13 per-
cent of $40,100 minus $24,000).
The bonus also rises when taxable income falls be-
tween $58,150 and $96,900 (when the differential be-
tween tax rates is 3 percentage points) and between
$121,300 and $147,700 (when the differential is 5 per-
centage points). In all other ranges of taxable income,
marginal tax rates do not differ for joint and single re-
turns and marriage bonuses do not change.
SOURCE: Congressional Budget Office.
they would receive in relation to what they would get if
they could file single or head-of-household returns.
The credit follows three schedules for childless
taxpayers, those with one child, and those with two or
more children that do not depend on filing status; that
is, the credit is the same for joint filers, heads of house-
hold, and single filers. Under each schedule, the credit
increases with earnings to a maximum, is constant at
that maximum for a range of earnings, and then de-
clines to zero (see Figure 2). Beginning with the 1995
tax year, tax units claiming the EITC also had to satisfy
an asset test that denies the credit to families with more
than $2,350 of income from interest, dividends, and
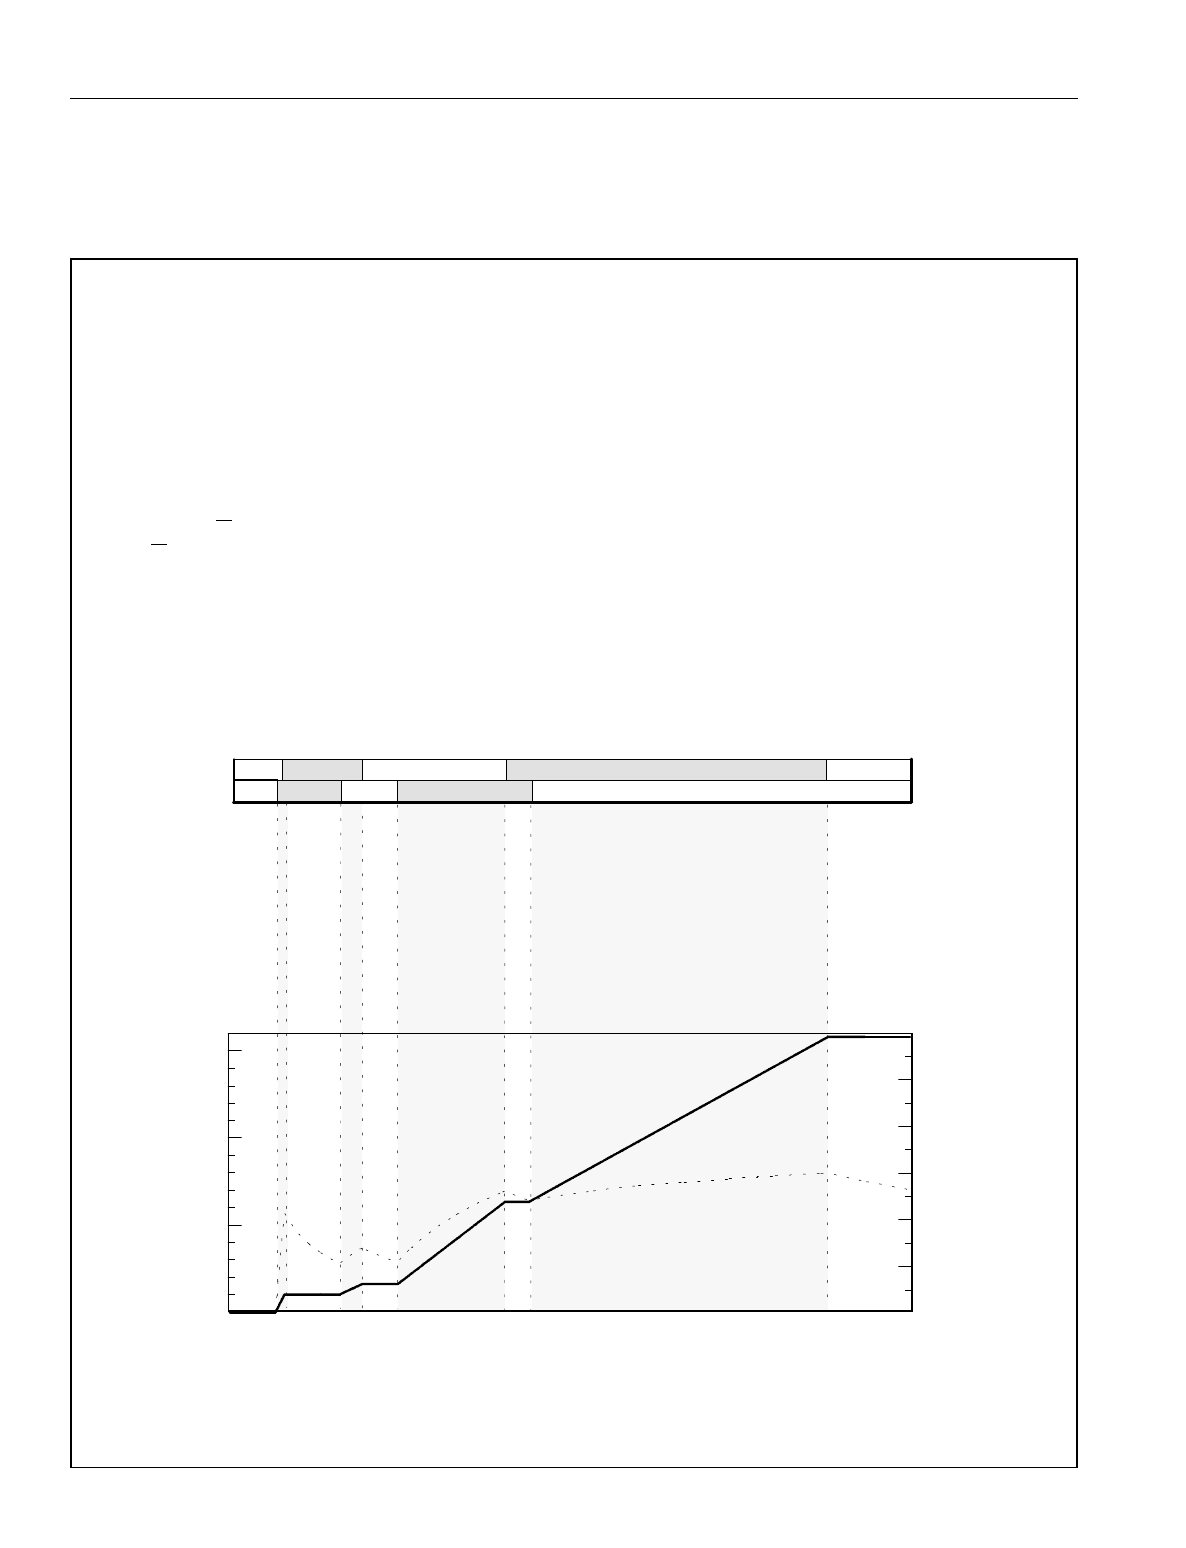
39.6
Filing Individually
Filing Jointly
Tax Brackets and Rates (In percent)
15 28
39.615 28
31
31
36
36
3.6 Percentage
Point
Differential
13 Percentage
Point
Differential
3 Percentage
Point
Differential
5 Percentage
Point
Differential
As a Percentage of
Taxable Income
(Right scale)
Marriage
Penalty
(Dollars)
Marriage
Penalty
(As a
percentage
of taxable
income)
Taxable Income (Dollars)
0
5,000
10,000
15,000
0
1
2
3
4
5
6
Dollars
(Left scale)
48,000 116,300 242,600
600,000
40,100 96,900 147,700 263,750 527,500
CHAPTER TWO SOURCES OF MARRIAGE PENALTIES AND BONUSES 19
Box 4.
1996 Marriage Penalties Resulting from Tax Brackets for
Two-Earner Couples in Which Spouses Have Equal Earnings
Tax brackets create marriage penalties when the mar-
ginal tax rate of a joint return exceeds that for an indi-
vidual return with the same taxable income. For exam-
ple, when a couple's taxable income is between $40,100
and $48,000, earned equally by both spouses, the mar-
ginal tax rate
that is, the tax on the last dollar of in-
come
on a joint return is 28 percent, whereas that on
two individual returns is 15 percent. The 13 percentage
point differential yields a marriage penalty of 13 cents
for each dollar of taxable income in that range, over
which the penalty, measured in dollars, rises from zero
to $1,027 (13 percent of $48,000-$40,100).
The penalty also rises when taxable income falls be-
tween $96,900 and $116,300 (when the differential be-
tween tax rates is 3 percentage points), between
$147,700 and $242,600 (when the differential is 5 per-
centage points), and between $263,750 and $527,500
(when the differential is 3.6 percentage points). In all
other ranges of taxable income, tax rates do not differ
for joint and individual returns and marriage bonuses do
not change.
SOURCE: Congressional Budget Office.
rent. That limitation could impose a marriage penalty
as well.
In 1996, the credit was largest for taxpayers with
two or more children, reaching a maximum of $3,556.
Families with one child could receive up to $2,152 and

0102030
0
1,000
2,000
3,000
4,000
Earned Income Credit (In dollars)
Two or More Children
One Child
No Children
Taxpayer's Earnings or Adjusted Gross Income
(In thousands of dollars)
20 FOR BETTER OR FOR WORSE: MARRIAGE AND THE FEDERAL INCOME TAX June 1997
childless taxpayers up to $323. For families with two
children, the credit equaled 40 percent of earnings up to
$8,890, was constant at $3,556 when earnings fell be-
tween $8,890 and $11,610, and declined by 21.06 per-
cent of AGI exceeding $11,610, disappearing entirely
when AGI was $28,495 or greater. (All parameters
apply to 1996; dollar values are adjusted for inflation
annually.) For families with one child, the maximum
credit of $2,152 applied for earnings between $6,330
and $11,610, and phased out completely when AGI
reached $25,078. Childless families received the maxi-
mum credit of $323 when their earnings fell between
$4,220 and $5,280 and received no credit when their
AGI exceeded $9,500.
Two aspects of the EITC lead to marriage penalties
and bonuses: the credit is the same for all filing sta-
tuses but differs according to the number of children.
Consider first the effect of fixed credit parameters
across filing statuses. Spouses who could qualify indi-
vidually for credits could lose some or all of them when
filing jointly because their combined income would
Figure 2.
Earned Income Tax Credit by Number of Children
and Earnings, 1996 Tax Law
SOURCE: Congressional Budget Office.
move them closer to or beyond the income at which the
credit becomes zero. In addition, when filing individu-
ally, spouses could qualify for two separate credits, not
just the one they can receive as joint filers. In 1996, for
example, a couple with two children in which both hus-
band and wife earn $11,000 incurred a marriage penalty
of more than $2,900 from the EITC alone (see Box 5).
Filing jointly in 1996, the couple qualified for a single
credit of $1,368. If the couple was not married and
each spouse filed as a head of household with one child,
each would have received the maximum EITC of
$2,152. Two factors cause the reduction in the credit,
which was more than 13 percent of the couple's earn-
ings. First, combining the husband's and wife's earn-
ings puts their total income into the range over which
the credit declines. Second, the couple would qualify
for two separate credits if they could file individually
but can receive only one credit as joint filers.
The EITC can also impose a marriage penalty on
higher-income two-earner couples if the division of
earnings between spouses is very different. A couple
with two children and $50,000 in earnings, split 80 per-
cent and 20 percent between husband and wife, would
receive no EITC when filing jointly and pay total taxes
of $4,965. If they were not married, however, the
lower-earning member of the couple could claim the
maximum one-child credit of $2,152, based on having
only $10,000 of earnings. Furthermore, each member
could file as head of household, and differences in us-
able standard deductions and personal exemptions
would further reduce the couple's separate taxes by
$615 below the amount they would pay if they filed
jointly, yielding a total marriage penalty of $2,767.
The higher EITC for families with more children
can yield marriage bonuses for couples with low earn-
ings. Combining two tax units can allow the resulting
couple to claim an EITC that is greater because taxpay-
ers with one child receive a larger percentage credit
than those with no children and families with two or
more children receive larger percentages than those
with only one child. For example, if a couple had one
child, the husband earned $6,000 in 1996, and the wife
did not work, they would qualify for an EITC of
$2,040. If they were not married and the child was as-
sociated with the mother, their EITC would be $268, all
going to the husband. Joint filing thus yields a bonus
of nearly $1,800 30 percent of their earnings. That
difference occurs because taxpayers with no children

CHAPTER TWO SOURCES OF MARRIAGE PENALTIES AND BONUSES 21
Box 5.
A Marriage Penalty for a Low-Income Couple with Children
A couple with two children and $22,000 in total earn-
ings, split evenly between the husband and the wife,
would have incurred a marriage penalty of $3,701 under
1996 tax law. The penalty results from two factors.
First, if they were not married, both the husband and the
wife could file as heads of household, each claiming one
child as a dependent. As heads of household, their com-
bined standard deductions would have been $11,800,
$5,100 more than the $6,700 standard deduction avail-
able on a joint return. At the couple's marginal tax rate
of 15 percent, the lower deduction would have increased
the couple's tax liability by $765 (15 percent of $5,100).
Second, filing separate returns, the husband and wife
each could have claimed the maximum earned income
tax credit (EITC) for a filer with one child, $2,152. Fil-
ing jointly, the couple would have received only one,
smaller EITC of $1,368. Thus, filing jointly the couple
would have received a payment of $603, about $3,700
less than the $4,304 they would have gotten if they
could have filed separately.
Husband
Wife Couple
aa
Adjusted Gross Income $11,000 $11,000 $22,000
Less personal exemptions 5,100 5,100 10,200
Less standard deduction 5,900 5,900 6,700
Equals taxable income 0 0 5,100
Tax (At 15 percent) 0 0 765
Less earned income tax credit 2,152 2,152 1,368
Tax Liability -2,152 -2,152 -603
Marriage Penalty $3,701
As a Percentage of Adjusted Gross Income 16.8
SOURCE: Congressional Budget Office.
a. Baseline for calculating marriage penalty assumes that both husband and wife file as head of household with one child.
receive a credit equal to 7.65 percent of earnings in the
phase-in range, whereas those with one child get a 34
percent credit, regardless of tax filing status. The vari-
ance of the EITC with the number of children in a tax
unit cannot impose a marriage penalty: combining chil-
dren into one unit does not lower either credit percent-
ages or the income ranges over which the credit in-
creases or decreases. Given that the credit does not
increase for tax units with additional children beyond
two means, however, some couples with more than two
children could incur a penalty. That penalty results
from the limitation of a couple to one credit, whereas
each member could receive a credit if they were not
married.
Families who have children and earnings below
$10,000 generally receive a marriage bonus because of
the phase-in of the EITC (see Figure 3). As incomes
rise above $10,000, two-earner couples with children
incur a marriage penalty as their total incomes lead to a
phaseout of their EITC. The penalty is greatest 15
percent of earnings for two-earner families with chil-
dren and total earnings between $20,000 and $30,000,
the range in which the EITC disappears for joint filers
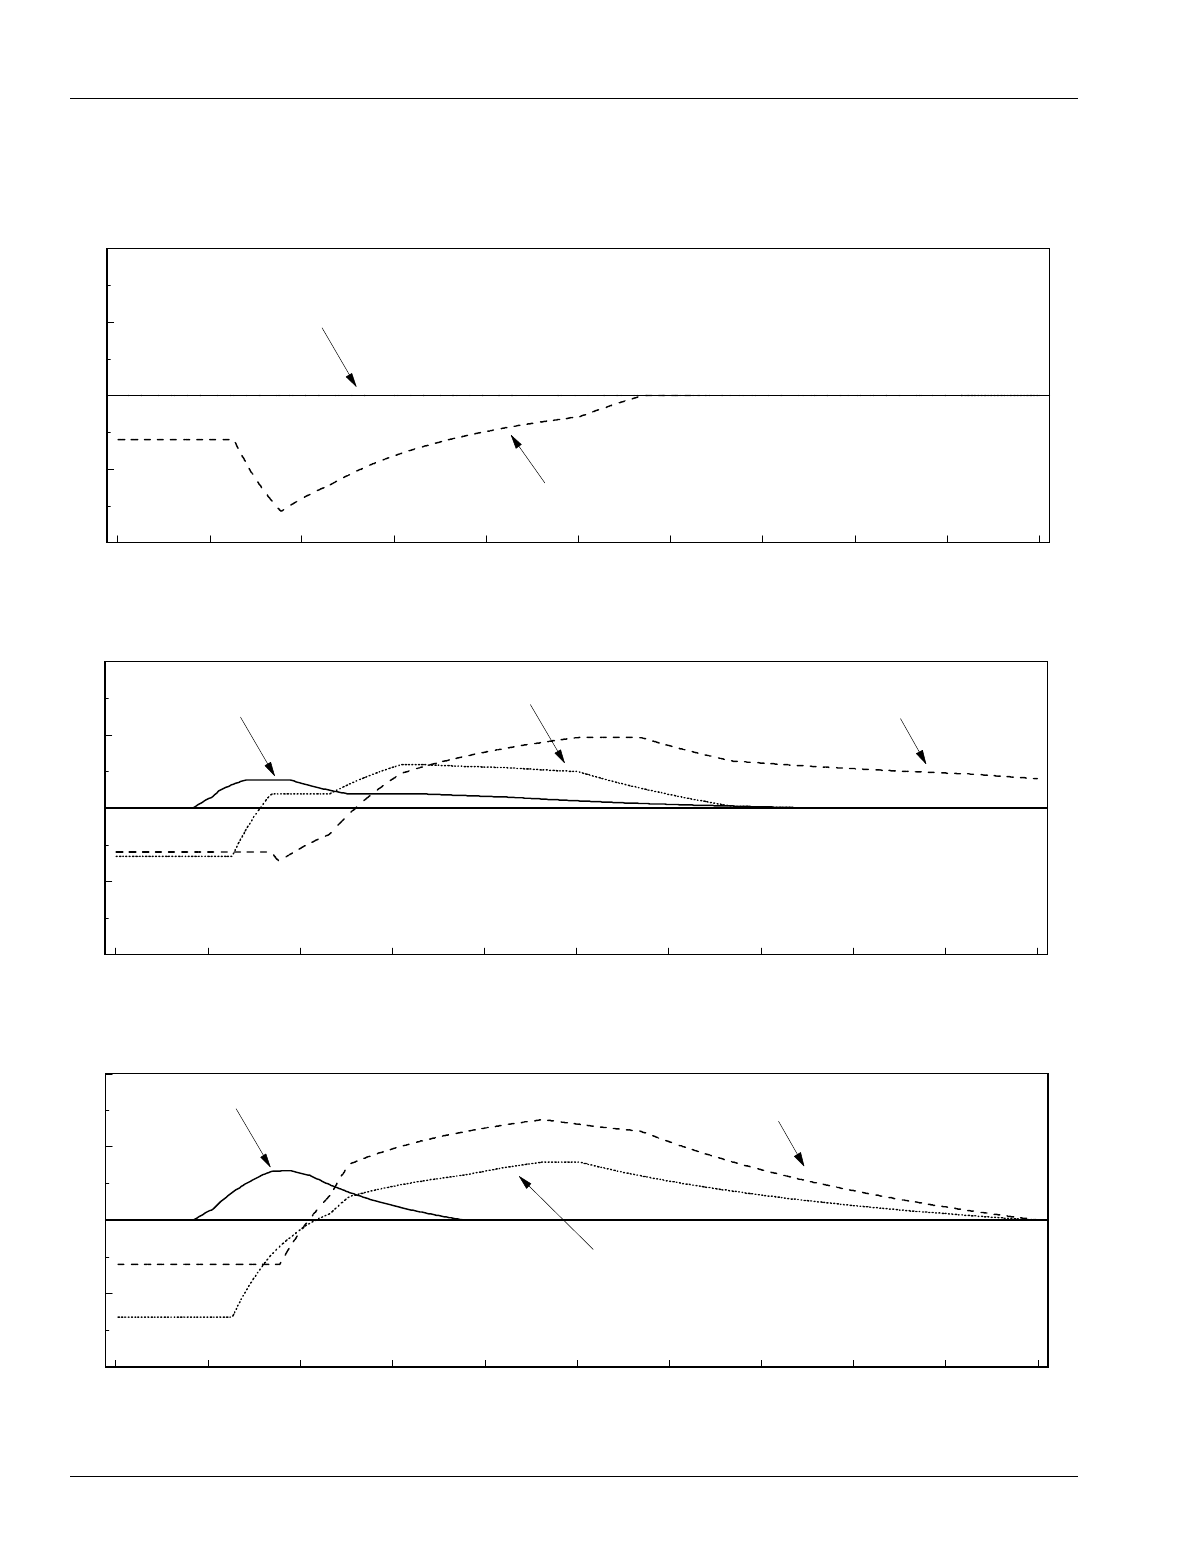
0 5 10 15 20 25 30 35 40 45 50
-20
-10
0
10
20
Couple's Earnings (In thousands of dollars)
Childless Couples and
Couples with One Child
Couples with Two Children
Marriage Penalty or Bonus (As a percentage of couple's earnings)
Couples with One Earner
0 5 10 15 20 25 30 35 40 45 50
-20
-10
0
10
20
Couple's Earnings (In thousands of dollars)
0 5 10 15 20 25 30 35 40 45 50
-20
-10
0
10
20
Couple's Earnings (In thousands of dollars)
Marriage Penalty or Bonus (As a percentage of couple's earnings)
Couples with One Spouse Contributing 75 Percent of Couple's Earnings
Childless Couples
Couples with One Child
Couples with Two Children
Marriage Penalty or Bonus (As a percentage of couple's earnings)
Couples with Both Spouses Contributing Half of Couple's Earnings
Childless Couples
Couples with One Child
Couples with Two Children
22 FOR BETTER OR FOR WORSE: MARRIAGE AND THE FEDERAL INCOME TAX June 1997
Figure 3.
Marriage Penalties and Bonuses Resulting from the Earned Income Tax Credit, 1996 Tax Law
SOURCE: Congressional Budget Office.
NOTE: Positive values indicate penalties; negative values indicate bonuses.

CHAPTER TWO SOURCES OF MARRIAGE PENALTIES AND BONUSES 23
but would still exist if the couple were not married and
earnings were split between parents. In 1996, the larg-
est penalty fell on couples with four or more children in
which each spouse earned $11,610. Filing jointly, such
a couple would receive a credit of $1,111. If the couple
were not married and each parent filed as a head of
household with two children, each would receive a
credit of $3,556, or a total of $7,112. The marriage
penalty attributable to the EITC would thus equal
$6,001, more than one-fourth of their earnings. Finally,
childless couples never get a tax bonus from the EITC,
but the credit may impose a penalty on those couples
with two earners whose combined income exceeds
$5,280.
The Phaseout of Personal Exemptions
High-income couples can receive marriage bonuses or
incur marriage penalties through a provision of the in-
come tax code that denies them some or all of the value
of their personal exemptions. In 1996, the phaseout
reduced the personal exemptions taxpayers could claim
by 2 percent for every $2,500 (or fraction of $2,500) by
which their adjusted gross income exceeds $117,950
for single filers, $147,450 for heads of household, or
$176,950 for joint filers. Because the threshold income
level for single people was two-thirds of the level for
married couples, unmarried couples with two high in-
comes could have combined incomes up to $58,950
higher than if they were married without being affected
by the phaseout.
That difference can result in single filers preserving
up to 46 percent of their personal exemptions, com-
pared with married couples. For a childless couple in
the 31 percent tax bracket, the difference would trans-
late into a marriage penalty of more than $700. If mar-
ried, the couple would lose 46 percent of their $5,000 in
personal exemptions $2,300. At a 31 percent tax rate,
the loss would increase their taxes by $713 31 percent
of $2,300. Couples with children could bear an even
larger penalty because, if they were not married, they
could file as heads of household and protect their ex-
emptions until their individual incomes reached
$147,450. The penalty borne by such couples could
exceed $2,900.
Conversely, couples who have one high-earner and
one non- or low-earner can receive marriage bonuses
because the phaseout of exemptions for couples starts
at a higher income level. In practice, the phaseout of
personal exemptions affects few couples: less than 3
percent of joint filers have incomes above the phaseout
threshold and not all of them incur marriage penalties.
The Limitation on Itemized Deductions
High-income couples can incur a marriage penalty be-
cause the tax code limits their itemized deductions more
than if they were not married. Regardless of filing sta-
tus, the limitation reduces the itemized deductions a
taxpayer can claim by 3 percent of the amount by which
adjusted gross income exceeds an indexed thresh-
old $117,950 in 1996. Because the threshold is the
same for both single and joint filing statuses, a couple
in which husband and wife each has AGI at the thresh-
old could claim their full itemized deductions if they
were not married but could deduct $3,539 (3 percent of
$117,950) less if they were married. The limitation,
however, cannot generate marriage bonuses. Again,
few couples are affected; less than 7 percent of joint
filers are subject to the limitation.
Other Fixed Dollar Limitations
Other features of the tax code that use fixed dollar val-
ues to limit reductions in taxable income or allowable
tax credits can generate marriage penalties or bonuses.
Limitations that do not differ by filing status, or that
are not high enough to offset for joint filers the effects
of combining a couple's income, impose higher tax lia-
bilities on married couples than if they were not mar-
ried. Such limitations include the dependent care credit,
the income limit for deductible individual retirement
accounts (IRAs), and the thresholds for taxation of So-
cial Security benefits, among others.
The dependent care credit, for example, declines
from 30 percent of allowed expenses for tax units with
incomes below $10,000 to 20 percent for those with in-
comes above $28,000, whereas allowed expenses can-
not exceed $2,400 for one child and $4,800 for two or
more children. A married couple with four children in
which the husband and wife each earn $24,000 could
receive a credit of $960, but both spouses could claim a
credit of $1,104 if they were not married. Most of the
decrease in the credit resulting from marriage derives
from limiting the total creditable child care expenses to
$4,800. Of the $1,248 penalty in the example, $144
results from the reduction in the percentage rate of the
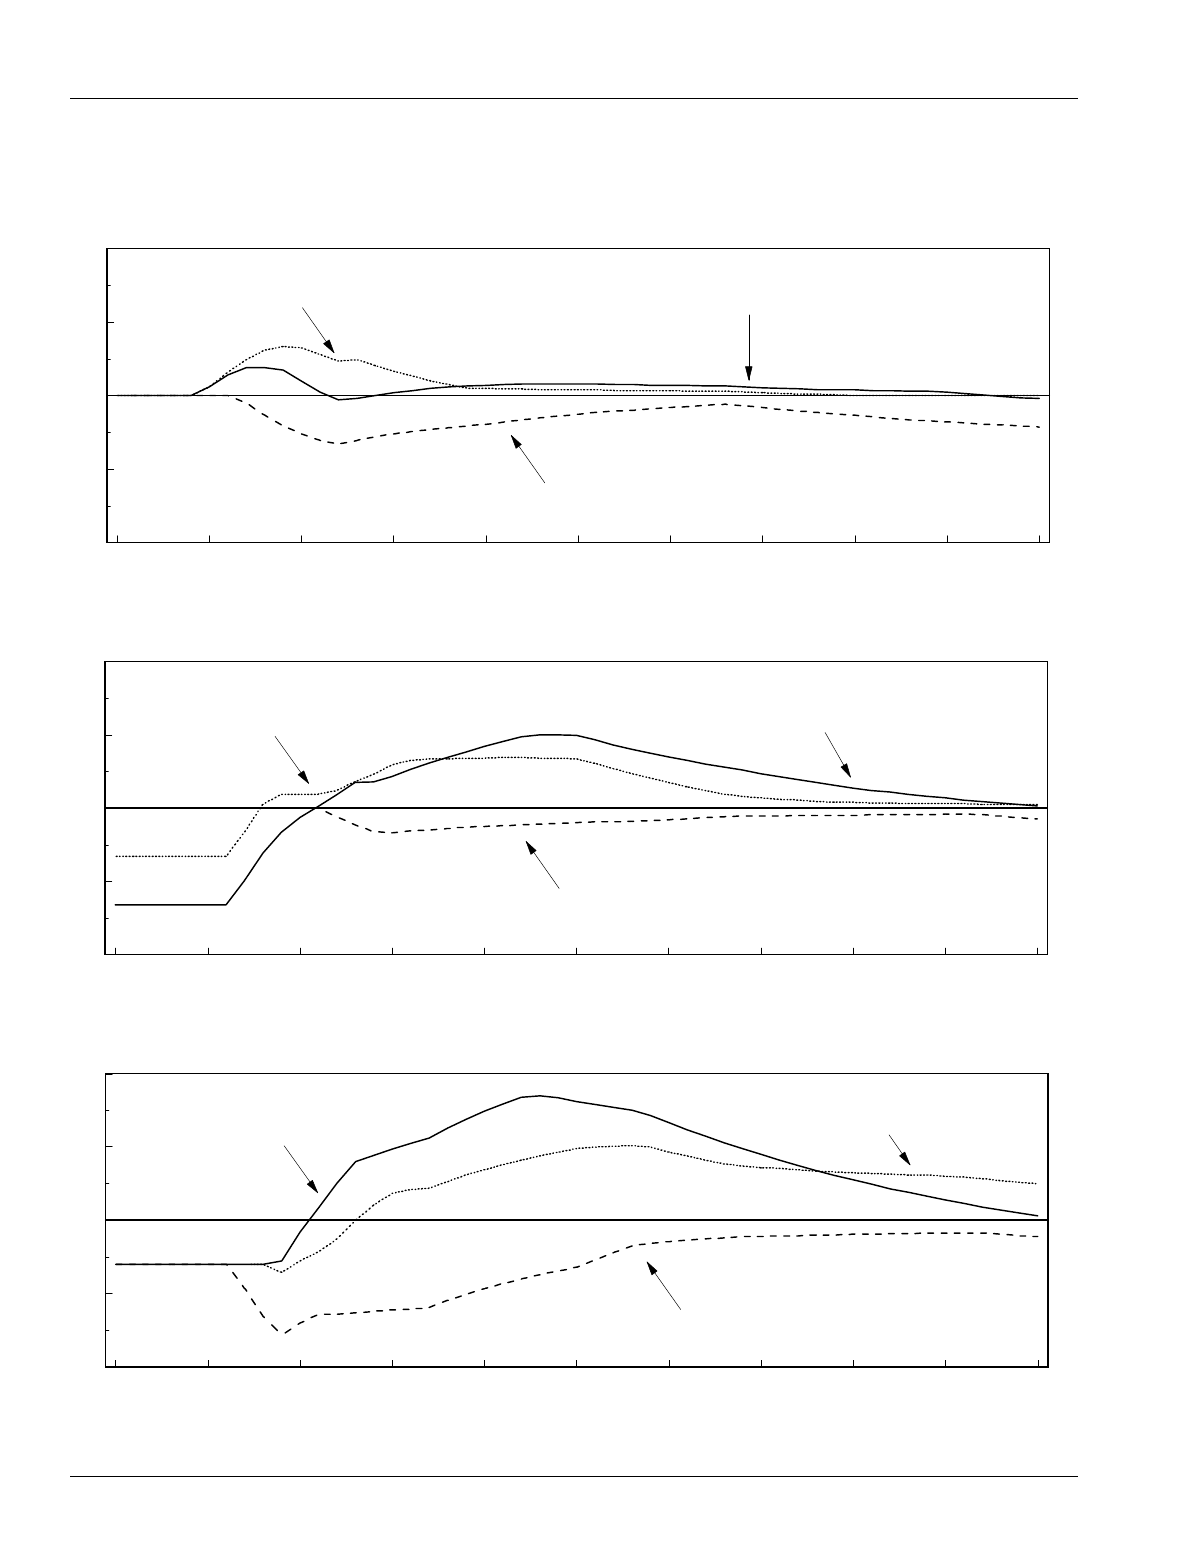
0 5 10 15 20 25 30 35 40 45 50
-20
-10
0
10
20
Couple's Earnings (In thousands of dollars)
Couples with One Spouse
Contributing 75 Percent of Earnings
Couples with One Earner
Marriage Penalty or Bonus (As a percentage of couple's earnings)
Childless Couples
0 5 10 15 20 25 30 35 40 45 50
-20
-10
0
10
20
Couple's Earnings (In thousands of dollars)
0 5 10 15 20 25 30 35 40 45 50
-20
-10
0
10
20
Couple's Earnings (In thousands of dollars)
Marriage Penalty or Bonus (As a percentage of couple's earnings)
Couples with One Child
Marriage Penalty or Bonus (As a percentage of couple's earnings)
Couples with Two Children
Couples with Both Spouses
Contributing Half of Earnings
Couples with One Spouse
Contributing 75 Percent of Earnings
Couples with Both Spouses
Contributing Half of Earnings
Couples with One Earner
Couples with Both Spouses
Contributing Half of Earnings
Couples with One Spouse
Contributing 75 Percent of Earnings
Couples with One Earner
24 FOR BETTER OR FOR WORSE: MARRIAGE AND THE FEDERAL INCOME TAX June 1997
Figure 4.
Marriage Penalties and Bonuses by Number of Children and Earnings Split, 1996 Tax Law
SOURCE: Congressional Budget Office simulations.
NOTE: Positive values indicate penalties; negative values indicate bonuses.

CHAPTER TWO SOURCES OF MARRIAGE PENALTIES AND BONUSES 25
credit and $1,104 comes from the limit on creditable
expenses.
Fixed-dollar limitations generate marriage bonuses
when the dollar limitation is higher for a couple than for
a single person and when one spouse adds little to the
measure that is subject to the limitation. For example,
a single earner can deduct up to $2,000 in contributions
to an IRA if he or she has earnings of at least $2,000
and if his or her adjusted gross income is not more than
$25,000, whereas a couple can do so if its income does
not exceed $40,000. A couple with both spouses earn-
ing $25,000 could take no IRA deduction, but each
member could deduct $2,000 if they were not married.
At the same time, a one-earner couple with a $40,000
income could take the full deduction, but neither spouse
could deduct any retirement contributions if he or she
were not married. Furthermore, the one-earner couple
could increase their deductible IRA contribution to
$4,000 because a spouse with no earnings can deduct
up to $2,000.
Which Cou
p
les Pa
y
the
Marria
g
e Tax?
Three factors have the greatest influence on whether a
couple bears a marriage penalty or receives a marriage
bonus: the couple's total income, the division of that
income between husband and wife, and the presence
and number of children (and other dependents) that de-
termine the filing status of unmarried individuals and
qualify taxpayers for the EITC and personal exemp-
tions.
The following analysis calculates marriage penal-
ties and bonuses as the differences in tax for a married
couple filing a joint return versus their filing two sin-
gle or, if applicable, head-of-household returns. All
income is assumed to be from earnings and each spouse
would claim the standard deduction or itemized deduc-
tions equal to 20 percent of earnings, whichever is
greater. That simplified calculation differs from the
more complete model used in Chapter 3 to estimate
marriage penalties and bonuses.
Couples with just one earner (and no unearned in-
come) never incur a marriage penalty and receive a bo-
nus at all but the lowest income levels. At low incomes,
that bonus results from the additional personal exemp-
tions and standard deduction brought to the marriage by
the nonworking spouse and, for couples with children,
larger earned income tax credits (see Figure 4). Upper-
income couples receive their bonuses primarily from the
tax-rate brackets that are wider for joint filers than for
single people.
The largest marriage bonuses, measured as a per-
centage of income, occur in two distinct cases. First,
two-earner couples with one child and very low incomes
split equally between spouses receive a larger EITC as
the credit phases in and thus receive a bonus of up to 13
percent of their income. Second, low-income single-
earner couples in which each spouse has one child, and
for whom combining children into one tax unit in-
creases the size of the EITC, receive bonuses of up to
11 percent of income (see Figure 4). The largest
bonuses in dollar terms
more than $5,600 go to
childless one-earner couples with incomes between
$180,000 and $190,000.
Marriage penalties generally increase as the divi-
sion of income between husband and wife becomes
more equal. At high incomes the penalties result pri-
marily from the different tax-rate brackets for each fil-
ing status, whereas the EITC and differences between
standard deductions for joint filers and single people or
heads of household dominate for couples with low in-
comes. Once again, the penalties, measured as a per-
centage of income, are greatest for low-income couples
who have several children and an equal division of in-
come between spouses; the loss of EITC on joint re-
turns can cost such families up to 18 percent of income.
In dollar terms, the penalty resulting from differences in
tax brackets, limitations on itemized deductions, and
the phaseout of personal exemptions combine to im-
pose the maximum penalty more than $21,500 on
couples whose income is equally divided between
spouses and whose taxable income exceeds $527,500.
Less than 1 percent of married couples have incomes
that high, however, and few of those are likely to have
income divided evenly enough between spouses to gen-
erate such large penalties.


N
Chapter Three
Magnitudes of Marriage
Penalties and Bonuses
early all married couples incur penalties or
bonuses that shift billions of dollars of income
taxes among taxpayers. Depending on how
marriage penalties are calculated, between 14 million
and 23 million married taxpayers incurred penalties
totaling between $8 billion and $40 billion in 1996. In
1
that year, between 24 million and 31 million other cou-
ples benefitted from between $32 billion and $45 bil-
lion in bonuses. Average penalties and bonuses in-
crease with income and more than half of the total value
of each falls on tax units with incomes above $50,000.
Only couples with no tax liability and those few with
incomes falling in specific ranges incur neither a pen-
alty nor a bonus. Less than 10 percent of all joint tax
filers are unaffected under any of the four measures of
bonuses and penalties described below.
Measurin
g
Marria
g
e Penalties
and Bonuses
The size and imposition of marriage penalties and bo-
nuses depend on the benchmark used for comparison
against actual tax liabilities. A marriage penalty equals
the amount by which a couple's tax liability under joint
filing exceeds the taxes they would pay if the income
tax code allowed them to file as individuals. If they
were allowed to file individually, however, it is not clear
whether the tax code would provide the same set of ex-
emptions, deductions, and credits currently available to
unmarried taxpayers. For example, without joint filing,
the code might not allow taxpayers to file as heads of
household and take advantage of the tax brackets avail-
able under that filing status. If joint filing was not gen-
erally required for married couples, the Congress might
elect to change dollar limits on various tax provisions,
thus raising or lowering the taxes owed by individual
filers. In sum, it is not clear exactly what provisions of
the tax code should provide the benchmark against
which to estimate marriage penalties and bonuses.
The aspects of the tax code used to calculate penal-
ties and bonuses determine both the size of those mea-
sures and which couples incur them. In general, mea-
sures that incorporate more aspects of the tax code gen-
erate larger penalties affecting more couples and
smaller bonuses for fewer couples. This analysis fo-
cuses on one basic measure of penalties and bonuses,
but it also compares their size and affected populations
under that measure with similar values calculated under
one broader and three more limited measures. The
choice of measure affects both the total amounts of
penalties and bonuses and which couples bear them.
Furthermore, the estimates of marriage penalties
and bonuses made in this analysis understate the full
costs of joint filing because they are derived from ob-
servations of couples' incomes under the existing tax
code. Thus, they do not account for behavioral changes
made in response to that code. If the high marginal tax
1. The estimates given in this chapter are based on data from the Internal
Revenue Service's Statistics of Income. See Appendix E for a descrip-
tion of those data.

28 FOR BETTER OR FOR WORSE: MARRIAGE AND THE FEDERAL INCOME TAX June 1997
rates facing second earners under joint tax filing induce
them to work less than they would under lower rates,
the estimated costs of requiring joint returns are too low
and the values assigned to bonuses too high. Overall,
2
joint filing requirements may reduce the labor supply of
married couples by about 1 percent. The forgone earn-
ings caused by the tax code impose costs not only on
the workers in the form of lower incomes but also on
society in the form of lost output. In addition, some
couples who appear to benefit from joint filing by re-
ceiving bonuses may actually be worse off: their tax
savings may result from their working less in response
to taxes rather than from the labor supply choices they
would make without taxes.
Finally, regardless of which aspects of the tax code
are used, estimates of penalties and bonuses must make
assumptions about the division of incomes, deductible
expenses and the assignment of dependents. One alter-
native would be a "divorce" model that would set the
following conditions of a divorce: spouses would re-
port their own incomes and itemize their own deduct-
ible expenses, and children would likely go with the
mother. A divorce model would be appropriate if the
relevant baseline consists of the taxes that a couple
would owe if they were to dissolve their marriage.
Alternatively, deductions, exemptions, and children
might be allocated so as to minimize each couple's joint
tax liability. A third possibility would rely on specific
rules for assignment. Estimates of penalties and bo-
nuses using either of those alternatives, rather than a
divorce model, would more likely reflect possible
changes that the Congress might make to alter the tax
treatment of married couples. Consequently, this study
relies on specific assumptions about the division of in-
comes, expenses, and dependents to quantify marriage
penalties and bonuses (see Appendix F for estimates of
penalties and bonuses under a divorce model).
The estimates of marriage penalties and bonuses
below are just that: estimates. Because they ignore
behavioral responses, they are not measures of how tax
revenues would change if married couples could file in-
dividual tax returns. Nor are they estimates of the full
economic costs of joint filing. They are simply the cal-
culated differences between the taxes married couples
pay under current law and the taxes they would pay if
they had to file individual tax returns given specific
assumptions about the division of incomes, itemizable
deductions, and dependent exemptions between
spouses.
This study's basic measure of penalties and bo-
nuses calculates the penalty or bonus a couple bears as
the difference between the taxes they would pay when
filing jointly under 1996 law and the taxes they would
pay if they filed singly given the following assump-
tions:
o A couple's income from investments is divided be-
tween spouses in proportion to their earnings.
Each spouse pays taxes on his or her earnings and
share of investment income. Couples with no earn-
ings are treated as one-earner couples.
o Spouses claim the couple's itemized deductions in
proportion to their individual incomes. A spouse
claims the appropriate standard deduction if it ex-
ceeds his or her share of the couple's itemized de-
ductions.
o All childless couples file two single returns.
o In couples with one child, the higher-earning
spouse claims the child as a dependent and files as
a head of household. The other spouse files a sin-
gle return.
o If a couple has two or more children, the lower-
earning spouse claims one child as a dependent and
files as a head of household. The other spouse
claims all other children and also files as head of
household.
o Both spouses can claim the earned income tax
credit if eligible.
To show how the measure used to assess penalties
and bonuses affects their magnitudes, the analysis also
considers one broader and three more restrictive alter-
natives (see Box 6 for a summary of all five measures).
The broader one is identical to the basic measure dis-
cussed above except that the higher-earning spouse
claims all of the couple's itemized deductions, and the
lower-earning spouse claims the appropriate standard
2. See "Effects on the Supply of Labor" in Chapter 1 of this study for a
discussion of behavioral responses to increased marginal tax rates.

CHAPTER THREE MAGNITUDES OF MARRIAGE PENALTIES AND BONUSES 29
Box 6.
Alternative Measures of Marriage Penalties and Bonuses
A marriage penalty or bonus equals the difference be-
tween the tax liability of a couple filing jointly and their
liability if they could file as individuals. The calculation
depends on assumptions about the taxes they would pay
if they filed individually. Calculations differ depending
on the division between spouses for tax purposes of un-
earned income, itemized deductions, and children,
whether individuals can file as heads of household, and
whether individuals can claim amounts of earned in-
come tax credits (EITCs) different from what they
would receive on joint returns. The following measures
differ in their assumptions about how couples would file
tax returns if they were allowed to file separately.
Basic Measure
: Spouses divide unearned income and
itemized deductions in proportion to their earnings. The
first child is assigned to the spouse with higher earnings,
the second to the lower-earning spouse, and all others to
the higher earner. If eligible, both spouses can file as
head of household and claim the earned income tax
credit.
Broader Measure
: Same as basic measure except that
the spouse with higher earnings claims all itemized de-
ductions and the lower earner takes the appropriate
standard deduction.
Basic Measure Less Head of Household
: Same as
basic measure except that spouses must file single re-
turns and cannot file as heads of household.
Basic Measure Less EITC
: Same as basic measure
except that penalty or bonus calculation excludes any
changes in eligibility for or amounts of the earned in-
come tax credit.
Basic Measure Less Head of Household and EITC
:
Same as basic measure except that spouses must file
single returns and cannot file as heads of household and
the penalty or bonus calculation excludes any changes in
eligibility for or amounts of the earned income tax
credit.
deduction. In general, that broader measure reduces
3
the tax liability that the couple would incur if spouses
filed individually and therefore increases the calculated
size and incidence of marriage penalties (it has the re-
verse effect on bonuses).
The more restrictive measures result in smaller pen-
alties and larger bonuses. The first does not allow par-
ents to file as heads of household but requires that they
file single returns. That restriction increases the base-
line tax liabilities used to calculate penalties and bo-
nuses and thus reduces the size of the penalties and the
population they affect. It also increases the size of bo-
nuses and the number of couples they affect.
A second more restrictive measure allows parents
to file as heads of household but excludes any effects of
changes in amounts of earned income tax credit that
they would be entitled to claim if they were allowed to
file separate returns. Omitting EITC effects has the
same impact on estimated penalties and bonuses that
denying head-of-household filing status does: the base-
line tax liabilities against which penalties and bonuses
are assessed increase, fewer couples incur penalties,
and more couples receive bonuses.
The final measure excludes both head-of-household
filing status and the savings that spouses would receive
from separately claiming the EITC. Combining the two
limitations increases the number of couples receiving
bonuses with a commensurate reduction in the number
of couples incurring penalties.
Total Marria
g
e Penalties
and Bonuses
Under the basic measure of penalties and bonuses,
nearly 21 million couples incurred marriage penalties
averaging nearly $1,400 apiece in 1996, raising their
taxes by a total of about $29 billion. At the same time,
another 25 million couples received bonuses averaging
3. This definition is proposed by Daniel R. Feenberg and Harvey S.
Rosen, most recently in "Recent Developments in the Marriage Tax,"
National Tax Journal
, vol. 47, no. 1 (March 1995), pp. 91-101.

30 FOR BETTER OR FOR WORSE: MARRIAGE AND THE FEDERAL INCOME TAX June 1997
$1,300 apiece, saving them a total of about $33 billion
in taxes (see Table 4). An additional 3 million couples
incurred neither penalties nor bonuses.
Thus, about 51 percent of all married couples paid
lower taxes in 1996 because they filed joint returns, and
42 percent paid more. Only 6 percent were unaffected.
Under the basic measure of the marriage penalty, cou-
ples paid a total of about $4 billion less in taxes than
they would have if they were required to file as individ-
uals.
The broader measure of marriage penalties and bo-
nuses results in larger estimates of the number and size
of penalties and smaller values for the number and size
of bonuses. Compared with the effects of the basic
measure, the broader concept would mean that an addi-
tional 2 million couples would incur penalties and the
Table 4.
Total Value of and Tax Returns with Marriage Penalties and Bonuses Under
Alternative Measures, Projected 1996
Basic
Broader Basic Basic Basic Measure
Measure Measure Measure Measure Less Head of
of Penalty of Penalty Less Head Less Household
and Bonus and Bonus of Household EITC and EITC
Joint Returns (Millions)
With Penalties 23.0 20.9 18.5 17.8 13.9
Unaffected 2.4 3.1 3.0 4.1 3.9
With Bonuses 23.9
25.3 27.7 27.3 31.4
Total 49.3 49.3 49.3 49.3 49.3
Joint Returns (Percent)
With Penalties4742383628
Unaffected56688
With Bonuses 49
51 56 55 64
Total 100 100 100 100 100
Total Value for Joint Returns (Billions of dollars
)
Penalties 40.2 28.8 18.1 17.0 8.5
Bonuses 32.2 32.9 42.2 33.2 44.7
Net Effect on
Tax Liability 7.9 -4.1 -24.1 -16.1 -36.2
a
Average Penalty or Bonus for Joint Returns (Dollars)
Penalties 1,750 1,380 980 960 610
Bonuses 1,350 1,300 1,520 1,210 1,420
SOURCE: Congressional Budget Office simulations based on data from the 1993 Statistics of Income.
NOTE: EITC = earned income tax credit.
a. Positive values indicate net penalties; negative values indicate net bonuses.

CHAPTER THREE MAGNITUDES OF MARRIAGE PENALTIES AND BONUSES 31
average penalty would rise to nearly $1,750, roughly a
25 percent increase. As a result, total penalties would
be 40 percent higher about $40 billion. More than 1
million fewer couples would receive bonuses, and the
total bonus would fall by less than $1 billion. Under
this measure, couples as a group would pay an addi-
tional $8 billion in taxes because they had filed joint
tax returns.
More restrictive measures would have opposite
effects. Denying the head of household filing status
would shift more than 2 million couples from penalties
to bonuses, reduce the total penalty by nearly $11 bil-
lion, and increase the total bonus by roughly $9 billion.
Under that measure, joint filing cuts the taxes paid by
couples by about $24 billion. Alternatively, restricting
the measure to exclude tax changes resulting from cou-
ples claiming additional EITC would reduce the number
of penalized couples by 3 million and shift 2 million
couples into bonus status. Compared with the basic
measure, it would reduce total penalties by more than
40 percent, but would have little effect on the total
value of bonuses.
Combining both restrictions that is, excluding
both head-of-household filing status and EITC differ-
ences would remove an additional 4 million couples
from the penalty category and give bonuses to about
4 million more couples. That tighter measure would cut
the total penalty to less than one-third of that estimated
under the basic definition. Overall, under this measure,
joint filing would reduce the total tax liability of mar-
Table 5.
Couples Receiving Marriage Penalties and Bonuses by Adjusted Gross Income, Projected 1996
Less Than $20,000- $50,000- $100,000 All
$20,000 $50,000 $100,000 and Over Incomes
Tax Returns (Thousands)
With Penalties 1,100 8,100 9,000 2,700 20,900
Unaffected 2,300 300 500 0 3,100
With Bonuses 5,800
10,000 7,200 2,300 25,300
Total 9,200 18,400 16,700 5,000 49,300
Percentage of All Returns in Income Category
With Penalties 12 44 54 54 42
Unaffected 25 1 3 0 6
With Bonuses 63
55 43 46 51
Total 100 100 100 100 100
Percentage of All Returns in Penalty,
Bonus, or Unaffected Category
With Penalties 5 39 43 13 100
Unaffected 74 10 16 0 100
With Bonuses 23 40 28 9 100
All Returns19373410100
SOURCE: Congressional Budget Office simulations based on data from the 1993 Statistics of Income.
NOTE: Marriage penalties and bonuses are calculated using the basic measure outlined in Box 6.

32 FOR BETTER OR FOR WORSE: MARRIAGE AND THE FEDERAL INCOME TAX June 1997
ried couples by about $36 billion below what they
would have owed if they had been required to file indi-
vidual returns.
The Distribution of Marria
g
e
Penalties and Bonuses
Marriage penalties and bonuses are not apportioned
evenly across the income distribution (see Table 5 on
page 31). Instead, lower-income couples are more
likely to receive bonuses, whereas higher-income cou-
ples are about equally likely to incur penalties or re-
ceive bonuses. In 1996, couples with an adjusted gross
income of less than $20,000 19 percent of all joint
filers made up 23 percent of bonus recipients but only
5 percent of couples incurring penalties. By contrast,
couples with an AGI between $50,000 and $100,000
34 percent of all couples represented 43 percent of
those bearing penalties and 28 percent of those receiv-
ing bonuses. Three-fourths of couples filing tax returns
and incurring neither bonuses nor penalties had an AGI
below $20,000. Those couples generally owed no
taxes, whether they filed jointly or singly.
In dollar terms, average marriage penalties and bo-
nuses rise with couples' incomes, but the reverse holds
when they are measured in relation to income (see
Table 6). In 1996, couples with bonuses and AGI be-
low $50,000 paid taxes averaging between $700 and
$900 less than what they would have paid if they had
filed singly, whereas those with bonuses and an AGI
above $100,000 saved an average of nearly $3,000 in
taxes by filing joint returns. Despite those large dollar
differences, the distribution of bonuses was progres-
sive. Affected couples with incomes below $20,000
received bonuses averaging 5 percent of their incomes
in 1996, double that for bonus recipients with incomes
between $20,000 and $100,000 and four times that for
those with incomes above $100,000.
Table 6.
Marriage Penalties and Bonuses by Adjusted Gross Income of Couple, Projected 1996
Less Than $20,000- $50,000- $100,000 All
$20,000 $50,000 $100,000 and Over Incomes
Total Penalty or Bonus for Affected Couples (Millions of dollars)
Penalties 900 9,600 11,100 7,200 28,800
Bonuses 3,900
8,700 13,500 6,800 32,900
Net Effect on
Tax Liability -3,000 900 -2,400 400 -4,100
a
Average Penalty or Bonus for Affected Couples (Dollars)
Penalties 770 1,190 1,240 2,640 1,380
Bonuses 680 870 1,880 2,970 1,300
Average Penalty or Bonus for Affected Couples (Percentage)
Penalties 7.6 3.2 1.7 1.4 2.0
Bonuses 5.0 2.6 2.8 1.2 2.3
SOURCE: Congressional Budget Office simulations based on data from the 1993 Statistics of Income.
NOTE: Marriage penalties and bonuses are calculated using the basic measure outlined in Box 6.
a. Positive values indicate net marriage penalties; negative values indicate net bonuses.

CHAPTER THREE MAGNITUDES OF MARRIAGE PENALTIES AND BONUSES 33
Table 7.
Joint Tax Returns by Penalty or Bonus Status and Division of Earnings Between Spouses, Projected 1996
Both Spouses
Each Spouse Had Earnings
Earned and One Spouse
at Least Contributed Only One
One-Third of More Than Spouse
Couple's Two-Thirds of Had All
Earnings Couple's Earnings Earnings Couples
a
Joint Returns
(
Thousands)
With Penalties 10,800 10,100 0 20,900
Unaffected 600 100 2,300 3,100
With Bonuses 600
5,300 19,400 25,300
All Joint Returns 12,000 15,500 21,700 49,300
Percentage of All Joint Returns
With Penalties 22 20 0 42
Unaffected 1 b 5 6
With Bonuses 1
11 39 51
All Joint Returns 24 31 44 100
Percentage of Joint Returns in Income Shares Category
With Penalties 90 65 0 42
Unaffected 5 1 11 6
With Bonuses 5
34 89 51
All Joint Returns 100 100 100 100
Percentage of Joint Returns in Penalty or Bonus Category
With Penalties 52 48 0 100
Unaffected 21 5 75 100
With Bonuses 2 21 77 100
All Joint Returns 24 31 44 100
SOURCE: Congressional Budget Office projections based on data from the 1993 Statistics of Income.
NOTES: Marriage penalties and bonuses are calculated using the basic measure outlined in Box 6.
See Table D-2 for additional data supporting this table.
a. Couples with no earners and those with one earner incur similar marriage penalties and bonuses and are thus combined in the analysis. For
simplicity of exposition, the text refers to both types of couples as having one earner.
b. Less than 0.5 percent.

34 FOR BETTER OR FOR WORSE: MARRIAGE AND THE FEDERAL INCOME TAX June 1997
Average penalties vary more widely in terms of
both dollars and percentage of income. Couples at the
bottom end of the income scale who incur penalties
paid an average of nearly $800 in additional taxes,
compared with marriage penalties averaging more than
$2,600 for couples with an AGI above $100,000. For
those in the bottom income category, however, that av-
erage penalty represented nearly 8 percent of income,
compared with less than 2 percent for couples incurring
penalties in the top category. Those couples in the
middle-income ranges who are affected namely, those
with an AGI between $20,000 and $100,000 incurred
penalties averaging about $1,200, not quite 3 percent of
their income.
In combination, marriage penalties and bonuses
raised the total taxes paid by couples with an AGI be-
tween $20,000 and $50,000 and by those with an AGI
above $100,000, and lowered taxes for couples in other
income categories. Filing joint returns increased the tax
bill of the first group by about $900 million in 1996
the difference between $9.6 billion in marriage penal-
ties and $8.7 billion in bonuses. The one-fifth of all
couples who have incomes below $20,000 benefited as
a group; about $3.9 billion in bonuses offset roughly
$900 million in penalties, yielding net tax savings of
about $3 billion because those couples file joint returns.
Couples with an AGI between $50,000 and $100,000
one-third of all joint filers paid nearly $2.4 billion less
in total taxes because they filed jointly, whereas those
in the top income group paid an additional $400 million
because they could not file as individuals. Nonetheless,
about one-half of all couples received bonuses and two-
fifths incurred penalties. The net effect within an in-
Table 8.
Marriage Penalties and Bonuses by Penalty or Bonus Status and Division of Earnings
Between Spouses, Projected 1996
Both Spouses
Each Spouse Had Earnings
Earned and One Spouse
at Least Contributed Only One
One-Third of More Than Spouse
Couple's Two-Thirds of Had All
Earnings Couple's Earnings Earnings Couples
a
Total Penalty or Bonus for Affected Couples (Millions of dollars)
Penalties 15,200 13,600 0 28,800
Bonuses 100
4,400 28,500 32,900
Net Effect on
Tax Liability 15,100 9,200 -28,500 -4,100
b
Average Penalty or Bonus for Affected Couples (Dollars)
Penalties 1,400 1,350 n.a. 1,380
Bonuses 90 830 1,470 1,300
SOURCE: Congressional Budget Office projections based on data from the 1993 Statistics of Income.
NOTES: Marriage penalties and bonuses are calculated using the basic measure outlined in Box 6.
See Table D-2 for additional data supporting this table.
n.a. = not applicable.
a. Couples with no earners and those with one earner incur similar marriage penalties and bonuses and are thus combined in the analysis. For
simplicity of exposition, the text refers to both types of couples as having one earner.
b. Positive values indicate net marriage penalties; negative values indicate net bonuses.

CHAPTER THREE MAGNITUDES OF MARRIAGE PENALTIES AND BONUSES 35
come category results from a significant redistribution
of tax liabilities from those individuals receiving bo-
nuses to those paying penalties.
Couples whose incomes are more equally divided
between husband and wife are more likely to incur mar-
riage penalties and less likely to receive bonuses than
couples in which one spouse's income is significantly
greater (see Table 7 on page 33). Couples with just one
earner made up 44 percent of all couples in 1996 but
represented 77 percent of all returns receiving bonuses,
lowering their income tax liabilities by more than $28
billion compared with what they would have owed if
they had filed individual returns (see Table 8). Virtu-
ally no one-earner couples paid marriage penalties. By
contrast, couples in which both spouses earned at least
one-third of their combined income one-quarter of all
couples were disproportionately likely to incur penal-
ties. In 1996 they filed 52 percent of all penalized re-
turns but only 2 percent of returns with bonuses. The
90 percent of such couples who incurred penalties paid
a total of $15 billion in additional taxes because they
filed jointly, an average penalty of about $1,400.
Two-earner couples whose income is less equally
divided between spouses were less likely to incur penal-
ties and more likely to receive bonuses than those with
a more equal division. Nearly two-thirds of two-earner
couples in which one spouse earned less than one-third
of total income paid penalties totaling over $13 billion,
Table 9.
Effective Individual Income Tax Rates of Married Couples Filing Individual or Joint Returns,
by Adjusted Gross Income and Division of Earnings Between Spouses, Projected 1996 (In percent)
Both Spouses
Each Spouse Had Earnings
Earned and One Spouse
at Least Contributed Only One
One-Third of More Than Spouse Nonelderly
Adjusted Gross Couple's Two-Thirds of Had Single
Income Earnings Couple's Earnings Earnings Filers
a
Effective Tax Rate when Couples File Joint Tax Returns
Less Than $20,000 -9.9 -12.9 -8.2 2.9
$20,000 - $50,000 8.5 7.8 7.3 10.7
$50,000 - $100,000 12.5 12.0 12.2 16.0
More Than $100,000 19.3 22.9 24.4 25.8
All Couples 13.2 15.2 15.0 11.3
Effective Tax Rate if Couples Were Required to File Individual Tax Returns
Less Than $20,000 -19.7 -13.1 -1.6 2.9
$20,000 - $50,000 5.4 5.9 10.1 10.7
$50,000 - $100,000 11.0 11.4 15.9 16.0
More Than $100,000 17.4 22.3 25.7 25.8
All Couples 11.2 14.3 17.6 11.3
SOURCE: Congressional Budget Office projections based on data from the 1993 Statistics of Income.
NOTE: Marriage penalties and bonuses are calculated using the basic measure outlined in Box 6.
a. Couples with no earners and those with one earner incur similar marriage penalties and bonuses and are thus combined in the analysis. For
simplicity of exposition, the text refers to both types of couples as having one earner.

36 FOR BETTER OR FOR WORSE: MARRIAGE AND THE FEDERAL INCOME TAX June 1997
and the other third received total bonuses of roughly $4
billion. The net effect raised taxes for all such couples
by a total of about $9 billion in 1996.
Effective Tax Rates of
Married Cou
p
les
Among all couples and within all income categories,
filing joint tax returns generally equalizes the effective
tax rates borne by one- and two-earner married couples,
thus roughly satisfying the goal of having couples with
equal incomes pay comparable taxes. The differences
in effective tax rates under joint and individual filing,
however, indicate that the goal of marriage neutrality is
not met. Couples who have incomes between $20,000
and $50,000, for example, paid taxes averaging about 8
percent of their incomes in 1996, regardless of how
much of their income was earned by each spouse (see
Table 9 on page 35). If couples had been required to
file individual returns, the average effective tax rate of
one-earner couples would have been 10 percent, double
the 5 percent rate paid by two-earner couples. A simi-
lar situation occurred for couples whose incomes were
between $50,000 and $100,000.
Joint filing appears to have had a less equalizing
effect on tax rates for couples whose incomes were
above $100,000 and for whom effective 1996 tax rates
ranged from 19 percent to 24 percent compared with a
range of average rates from 17 percent to 26 percent
under individual filing. The lower effective tax rate
results because two-earner couples in which both hus-
band and wife earn at least one-third of total income
had, on average, lower incomes than other high-income
couples.
A similar but reversed situation occurred for cou-
ples who had incomes below $20,000. Low-income,
two-earner couples had, on average, higher incomes
than their one-earner counterparts. Those with more
equal splits of earnings between husband and wife had
higher incomes than those for which the split was less
equal. That income inequality among types of couples
led to a significant divergence of effective tax rates un-
der joint filing (-8 percent to -13 percent), although that
spread was narrower than that which would have
occurred under individual filing (-2 percent to -20 per-
cent).
4
At all income levels, married couples incurred
markedly lower effective 1996 tax rates than single tax-
payers, largely because of the separate tax schedules for
the two groups and because couples generally can claim
more personal exemptions than single filers. Tax units
whose AGI was above $20,000 faced average effective
tax rates between 1 percentage point and 6 percentage
points lower if they were couples than if they were sin-
gle taxpayers. The difference was much larger 10
percentage points or more for tax units whose AGI
was under $20,000, primarily because the EITC was
more likely to go to couples than to single filers. The
generally lower incomes of single filers mean that as a
group, they pay a smaller share of their incomes in
taxes than married couples.
5
4. Negative tax rates imply that taxpayers receive a payment rather than
paying a tax.
5. Appendix G discusses the distribution of different types of families
across income categories. Working-age married couples are more
likely to be in higher-income categories than are families headed by
working-age single people or the elderly.

1969 1973 1977 1981 1985 1989 1993
0
20
40
60
80
100
Only Husband Worked
Both Husband and Wife Worked
Only Wife Worked
Neither Husband nor Wife Worked
Cumulative Percentage of Married Couples
I
Chapter Four
Labor Market and Demographic
Changes Affecting Marriage
Penalties and Bonuses
n the last two decades, the share of married cou-
ples who have two earners has risen sharply as
the difference between the earnings of husbands
and wives has decreased, particularly for couples with
higher incomes. Those labor market and demographic
changes, which have affected both childless couples and
those with children, have helped to increase the fraction
of couples incurring marriage penalties and drop the
proportion receiving marriage bonuses.
Between 1969 and 1995, the share of all married
couples in which both spouses worked increased from
46 percent to 60 percent, whereas the proportion with
just one worker fell from 46 percent to 25 percent (see
Figure 5). Over the same period, the fraction of cou-
1
ples with no workers nearly doubled from 8 percent to
15 percent, reflecting the growth of the elderly popula-
tion and the falling rates of labor force participation
among older men. Thus, although one-half of working
married couples had just one earner in 1969, that share
had dropped to less than one-third by 1995.
The increasing likelihood of married couples hav-
ing two earners was offset during the period by the de-
cline in married couples as a share of all families and
individuals (see Figure 6). For simplicity of exposition,
the following discussion refers to this group as "fami-
lies," including individuals not living with relatives as
families with a single member. In 1969, married cou-
ples made up two-thirds of all families; by 1995, that
share had dropped to one-half. Most of the shift re-
Fi
g
ure 5.
Work Patterns of Married Couples, 1969-1995
SOURCE: Congressional Budget Office tabulations of data from
the Current Population Survey. Data limitations required
interpolation of values for five years: 1970, 1972, 1974,
1975, and 1977.
1. The tabulations presented in this chapter are generally derived from
data from the Current Population Survey by the Bureau of the Census.
See Appendix E for a description of those data.
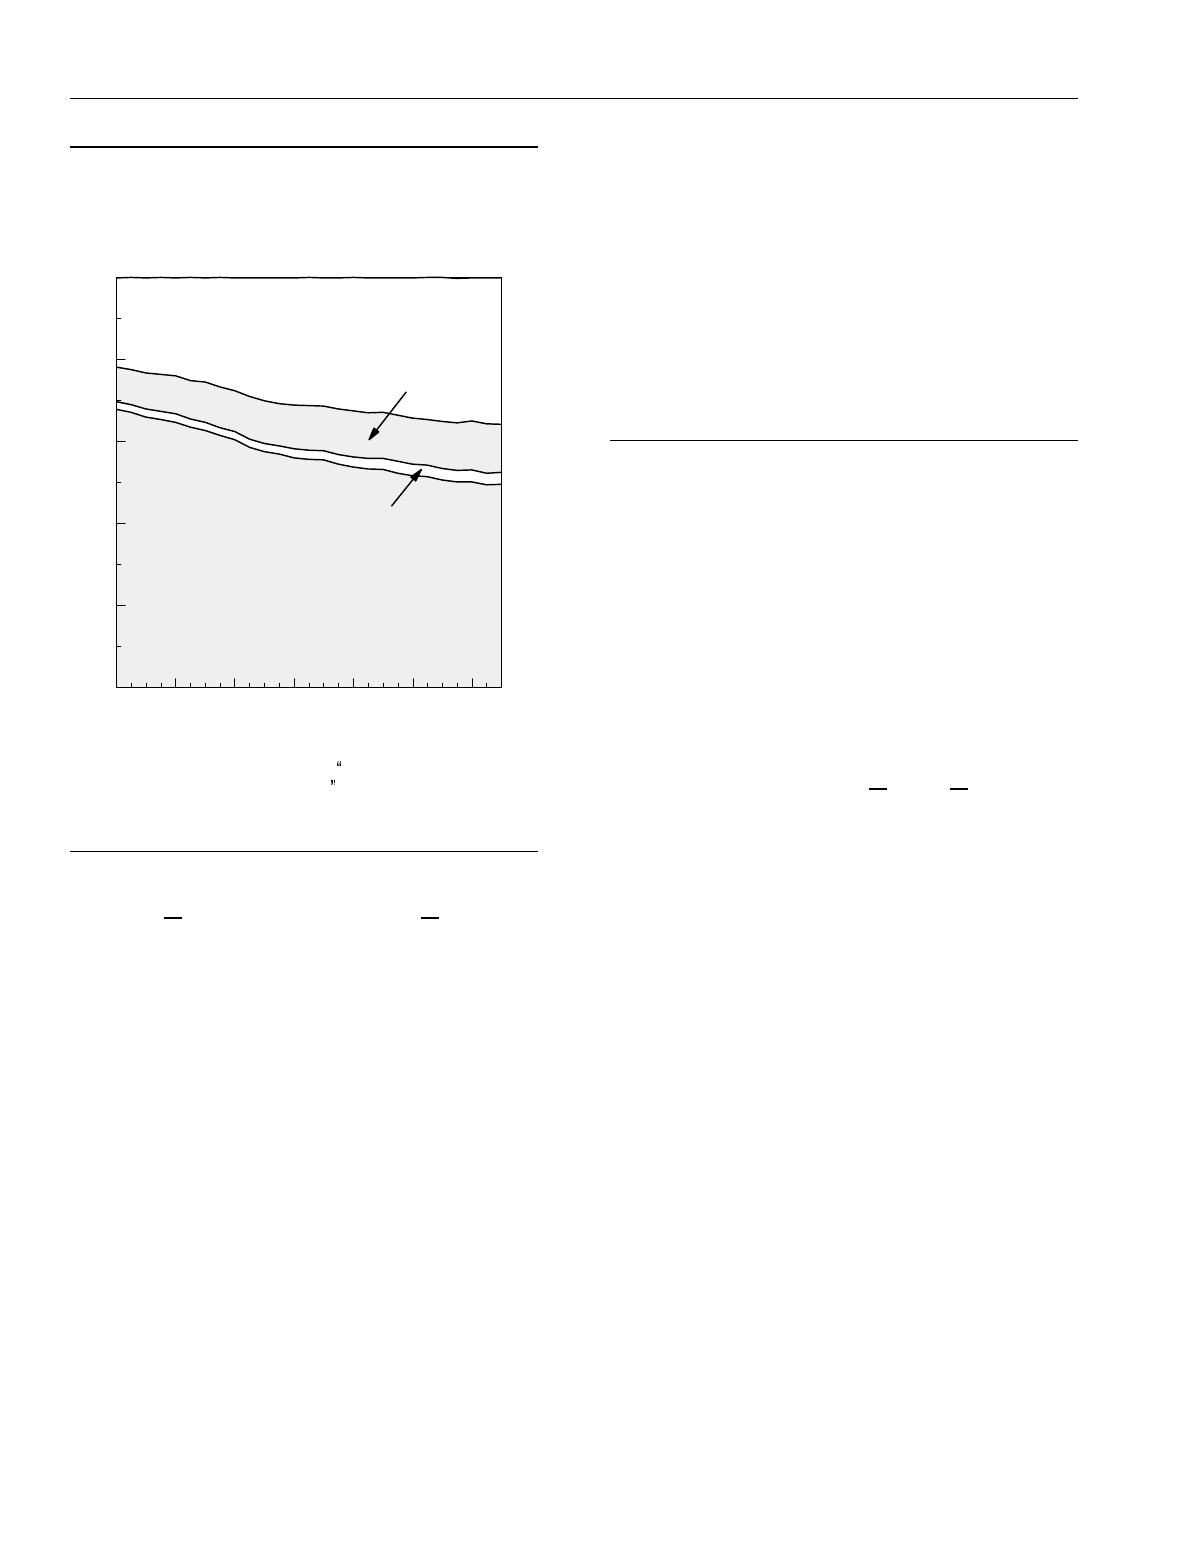
1969 1973 1977 1981 1985 1989 1993
0
20
40
60
80
100
Percentage of All Families and Unrelated Individuals
Unrelated Individuals
Families Headed by Females
Families Headed by Males
Married Couples
38 FOR BETTER OR FOR WORSE: MARRIAGE AND THE FEDERAL INCOME TAX June 1997
Fi
g
ure 6.
Distribution of Families and Unrelated
Individuals b
y
T
y
pe, 1969-1995
SOURCE: Congressional Budget Office tabulations based on data
in Bureau of the Census,
Household and Family Char-
acteristics: March 1993,
Current Population Reports
,
Series P20, No. 477 (June 1994), and unpublished data
from the Bureau of the Census.
sulted from sharp increases in the number of unrelated
individuals that is, one-person families whose pro-
portion rose from just over one-fifth in 1969 to more
than one-third in 1995. The fraction of all families
headed by unmarried women living with relatives,
mostly mothers and their children, grew less rapidly
over the 1969-1995 period: from 9 percent to 12 per-
cent of all units. The decline in the relative number of
married-couple families indicates that a smaller fraction
of families file joint tax returns. As a result, fewer fam-
ilies may incur marriage penalties or bonuses today
than was the case 25 years ago, even though the chang-
ing characteristics of married couples may have sub-
jected more couples to penalties.
Counts of actual tax returns filed in 1969 and 1993
provide somewhat different information but generally
confirm those changes. In 1969, 60 percent of returns
were filed by married couples, 4 percent by heads of
household, and 36 percent by single people. By 1993,
married returns had declined to 44 percent, heads of
household had tripled to 13 percent, and single returns
had risen to 42 percent. Those values differ from the
overall demographic data for two reasons: first, low-
income people need not file returns and generally do so
only to get refunds or the EITC; and second, single de-
pendents file their own returns if they have sufficient
income. Heads of household with low incomes may be
more likely to file returns than other low-income people
because they are likely to qualify for the EITC (which
did not exist in 1969).
Workin
g
-A
g
e Married
Cou
p
les
Since 1969, working-age married couples have become
increasingly likely to have two earners and to have a
more equal distribution of earnings between husband
and wife (see Table 10). That analysis defines working
-age couples with earnings as married couples in which
both the husband and wife are between 25 and 64 years
old; in which neither the husband nor the wife reports
negative earnings from self-employment; and in which
either the husband or the wife or both reports posi-
tive earnings.
Limiting the age range for couples restricts obser-
vations to the population most likely to be in the labor
force, thereby avoiding younger couples who may not
yet have completed their education and older people
who may have only loose ties to the labor force. Omit-
ting couples with negative earnings eliminates the con-
fusion that such uncommon units might create, and re-
quiring that couples have some earnings focuses the
analysis on couples in the labor force. For 1995, con-
straining the base population in those ways omits just
over one-fourth of all married couples. (See Appendix
H for a more complete discussion of limitations im-
posed on the observed population.)
The fraction of working-age married couples in
which both spouses held jobs rose from just under one-
half in 1969 to nearly three-fourths in 1995. Over the
same period, the fraction of couples in which both hus-
band and wife earned at least one-third of the couple's
total earnings doubled from 17 percent to 34 percent.
The near halving of the proportion of couples with just
one worker reduced the likelihood that couples would

CHAPTER FOUR LABOR MARKET AND DEMOGRAPHIC CHANGES AFFECTING MARIAGE PENALTIES AND BONUSES 39
Table 10.
Distribution of Workin
g
-A
g
e Married Couples, b
y
Division of Earnin
g
s Between Spouses in
1969, 1979, 1989, and 1995
Both Spouses Had
Each Spouse Earnin
g
s and One Spouse
Earned at Least Contributed More
One-Third of Than Two-Thirds of Onl
y
One Spouse
Year Couple's Earnin
g
s Couple's Earnin
g
sHad Earnin
g
s All Couples
Working-Age Married Couples (Thousands)
1969 5,600 10,100 16,700 32,400
1979 7,500 12,700 13,700 34,000
1989 11,800 15,100 11,300 38,200
1995 13,600 15,200 11,300 40,100
Percentage of All Working-Age Married Couples
1969 17.2 31.2 51.7 100.0
1979 22.2 37.4 40.4 100.0
1989 30.9 39.5 29.5 100.0
1995 33.9 37.9 28.2 100.0
SOURCE: Congressional Budget Office tabulations of data from the March Current Population Survey for 1970, 1980, 1990, and 1996.
NOTE: Working-age married couples include only those in which both spouses are between ages 25 and 64, neither spouse has negative earnings,
and at least one spouse has positive earnings.
receive marriage bonuses, and the greater equality of
earnings between spouses increased both the share of
couples bearing marriage penalties and the size of those
penalties. The changes in the earnings patterns of mar-
ried couples varied markedly, depending on a couple's
total earnings, age, and presence and number of chil-
dren.
Chan
g
es in Earnin
g
s Amon
g
Income Cate
g
ories
Between 1969 and 1995, the percentage of working-age
married couples in which both husband and wife
worked increased at all earnings levels, but rose more
for couples with high earnings than for those with low
earnings (see Table 11). In 1995, 31 percent of couples
with earnings below $20,000 in 1995 dollars had
two workers, compared with 29 percent in 1969. By
contrast, the share of couples with two earners whose
combined earnings were between $50,000 and
$100,000 increased over the same period from 63 per-
cent to 87 percent. Nearly 80 percent of couples in the
highest earnings group
more than $100,000 had two
earners in 1995, almost double the 43 percent of 1969.
By the end of the period, couples in the highest income
category were more likely to have two earners than
those whose incomes were below $50,000 and nearly as
likely as those whose incomes were between $50,000
and $100,000.
In part, the shift results from two earners generat-
ing more income than one, so that a couple in which
both husband and wife work is less likely to have earn-
ings low enough to fall into the bottom income cate-
gory. Having two earners increases the likelihood that
a couple's income puts them in one of the higher earn-
ings categories. Regardless of the reason for the shift,
the rise in two-earner couples over the last quarter cen-
tury was concentrated in the higher income categories,
where marriage penalties are generally larger and more
prevalent. The shift in working patterns of married
couples has thus intensified the problem of marriage
penalties.

40 FOR BETTER OR FOR WORSE: MARRIAGE AND THE FEDERAL INCOME TAX June 1997
Table 11.
Percenta
g
e of Workin
g
-A
g
e Married Couples with Two Earners, b
y
Total Income in 1969, 1979, 1989, and 1995
More
Less Than $20,000- $50,000- Than All
Year $20,000 $50,000 $100,000 $100,000 Incomes
1969 28.5 46.0 62.7 43.0 48.3
1979 29.5 56.3 73.4 56.7 59.6
1989 38.0 66.6 82.7 78.7 70.5
1995 30.9 69.7 87.0 78.6 71.8
SOURCE: Congressional Budget Office tabulations of data from the March Current Population Survey for 1970, 1980, 1990, and 1996.
NOTES: Working-age married couples include only those in which both spouses are between ages 25 and 64, neither spouse has negative earnings,
and at least one spouse has positive earnings.
Incomes are measured in 1995 dollars.
Husbands and wives now earn more nearly equal
incomes than they did 25 years ago. The change oc-
curred within all income groups, but was more pro-
nounced among those with the highest earnings (see
Table 12). Among working-age couples with total
earnings between $20,000 and $50,000 (in 1995 dol-
lars), the proportion of couples in which both spouses
earned at least one-third of the couple's total earnings
doubled from 15 percent in 1969 to 32 percent in 1995.
Couples whose total earnings were above $100,000
showed even greater movement toward equal earnings
between spouses: over the 1969-1995 period, the frac-
tion of those couples in which each spouse earned at
least one-third of the couple's earnings tripled from
10 percent to 33 percent. Even so, in 1995, an equal
division of earnings between spouses was most likely
for couples in the next lower income category (between
$50,000 and $100,000).
Both the increased likelihood of having two earners
and the greater equality of husbands' and wives' earn-
ings increased the chances that working couples would
incur a marriage penalty at income tax time. Those
shifts were more likely to occur for couples with high
earnings, which aggravated the situation because
higher-income families generally bear greater marriage
penalties in dollar terms, although not as a percentage
of income (see Table 6 in Chapter 3).
Chan
g
es in Earnin
g
s Amon
g
A
g
e Cate
g
ories
Both the portion of working-age couples with two earn-
ers and the equality of earnings between husband and
wife increased for all age groups between 1969 and
1995, but the increases were greater for couples in
which both spouses were under age 55 (see Tables 13
and 14). In 1969, roughly one-half of working couples
in each age category defined in terms of the age of the
older spouse had two earners, and couples in the 55 to
64 age group were only slightly less likely than younger
couples to have two workers. By 1995, three-quarters
of couples in each of the younger age groups had two
earners compared with less than 60 percent of couples
in the oldest age category. The trend of wives entering
the labor force appears to have been offset in the oldest
age group in which the older spouse was between 55
and 64 years old by the decreasing participation of
men over age 55.
Between 1969 and 1995 husbands and wives in
every age group moved toward greater equality of earn-
ings, and again the trend was stronger for younger cou-
ples. The share of couples in which both spouses
earned at least one-third of the couple's income more

CHAPTER FOUR LABOR MARKET AND DEMOGRAPHIC CHANGES AFFECTING MARIAGE PENALTIES AND BONUSES 41
Table 12.
Percenta
g
e Distribution of Workin
g
-A
g
e Married Couples, b
y
Division of Earnin
g
s Between
Spouses and Total Income in 1969, 1979, 1989, and 1995
Both Spouses Had
Each Spouse Earnin
g
s and One Spouse
Earned at Least Contributed More
One-Third of Than Two-Thirds of Onl
y
One Spouse
Year Couple's Earnin
g
s Couple's Earnin
g
s Had Earnin
g
s
All Income Cate
g
ories
1969 17.2 31.2 51.7
1979 22.2 37.4 40.4
1989 30.9 39.5 29.5
1995 33.9 37.9 28.2
Couple's Income Less Than $20,000
1969 7.1 21.4 71.5
1979 9.7 19.9 70.5
1989 12.3 25.7 62.0
1995 11.6 19.3 69.1
Couple's Income $20,000 to $50,000
1969 14.9 31.1 54.0
1979 20.3 36.0 43.7
1989 27.3 39.4 33.4
1995 32.1 37.6 30.3
Couple's Income $50,000 to $100,000
1969 27.4 35.4 37.3
1979 29.3 44.1 26.6
1989 40.2 42.5 17.3
1995 44.4 42.7 13.0
Couple's Income More Than $100,000
1969 9.9 33.1 57.0
1979 16.0 40.6 43.3
1989 32.5 46.3 21.3
1995 32.5 46.1 21.4
SOURCE: Congressional Budget Office tabulations of data from the March Current Population Surveys for 1970, 1980, 1990, and 1996.
NOTES: Working-age married couples include only those in which both spouses are between ages 25 and 64, neither spouse has negative
earnings, and at least one spouse has positive earnings.
Incomes are measured in 1995 dollars.

42 FOR BETTER OR FOR WORSE: MARRIAGE AND THE FEDERAL INCOME TAX June 1997
Table 13.
Percenta
g
e of Workin
g
-A
g
e Married Couples with Two Earners, b
y
A
g
e of Older Spouse
in 1969, 1979, 1989, and 1995
A
g
e of Older Spouse All A
g
e
Year 25-34 35-44 45-54 55-64 Groups
1969 46.5 49.5 51.2 44.8 48.3
1979 67.7 63.5 59.8 44.8 59.6
1989 76.0 74.2 71.8 54.0 70.5
1995 76.7 74.1 74.2 57.9 71.8
SOURCE: Congressional Budget Office tabulations of data from the March Current Population Surveys for 1970, 1980, 1990, and 1996.
NOTE: Working-age married couples include only those in which both spouses are between ages 25 and 64, neither spouse has negative earnings,
and at least one spouse has positive earnings.
than doubled for those under age 45, from 15 percent in
1969 to more than 35 percent in 1995. By contrast, the
oldest age group experienced little change in the equal-
ity of earnings between spouses, and the comparable
value rose only 7 percentage points from 19 percent to
26 percent. The greater equality of earnings for youn-
ger couples means that they are significantly more
likely to incur marriage penalties than their older coun-
terparts, all else being equal. Furthermore, if the ten-
dency toward greater earnings equality among the
young signals a long-term trend that will extend over
time into older age groups, the pattern may foreshadow
further increases in the number of couples who will be
subject to marriage penalties in the future.
Chan
g
es in Earnin
g
s b
y
Number of Children
Working-age couples were more likely to have two
earners in 1995 than in 1969, regardless of how many
children they had. By 1995, more than two-thirds of
couples in each category with none, one, and two or
more children had two earners. The increase in that
likelihood over the period was greater for those with
two or more children than for those with none or one
(see Table 15). Between 1969 and 1995, the fraction
of couples with two or more children and both parents
working rose by more than one-half, from 43 percent to
69 percent. By contrast, comparable values for child-
less couples grew about one-third, from 53 percent to
72 percent, largely because childless couples are gener-
ally older than couples with children and, as discussed
above, older couples are less likely than their younger
counterparts to have two earners.
Equality of earnings between spouses also in-
creased during the 1969-1995 period for couples, re-
gardless of the number of children, and couples with
children had larger increases than those with none.
Even so, at the end of the period, couples with two or
more children had less parity of earnings than other
couples (see Table 16). In 1969, one-fourth of child-
less couples had both spouses earning at least one-third
of their total income, compared with one-fifth of cou-
ples with one child and one-ninth of couples with two
or more children. By 1995, more than 36 percent of
couples with no children or one child showed that de-
gree of earnings equality
about 7 percentage points
more than couples with two or more children. Couples
with children are more likely than their childless coun-
terparts to incur marriage penalties, especially at lower
earnings levels, and the increased equality of earnings
between spouses served only to aggravate the situation
during the 1969-1995 period.
One rationale for the tax code's equal treatment of
one- and two-earner couples could be to provide an in-
direct subsidy for families in which one parent stays
home to care for children. Such a rationale might be

CHAPTER FOUR LABOR MARKET AND DEMOGRAPHIC CHANGES AFFECTING MARIAGE PENALTIES AND BONUSES 43
Table 14.
Percenta
g
e Distribution of Workin
g
-A
g
e Married Couples, b
y
Division of Earnin
g
s Between
Spouses and A
g
e of Older Spouse in 1969, 1979, 1989, and 1995
Both Spouses Had
Each Spouse Earnin
g
s and One Spouse
Earned at Least Contributed More
One-Third of Than Two-Thirds of Onl
y
One Spouse
Year Couple's Earnin
g
s Couple's Earnin
g
s Had Earnin
g
s
All A
g
e Groups
1969 17.2 31.2 51.7
1979 22.2 37.4 40.4
1989 30.9 39.5 29.5
1995 33.9 37.9 28.2
Older Spouse A
g
e 25-34
1969 15.2 31.4 53.5
1979 27.4 40.3 32.3
1989 36.2 39.8 24.0
1995 39.9 36.7 23.3
Older Spouse A
g
e 35-44
1969 14.7 34.8 50.5
1979 21.9 41.6 36.5
1989 32.2 42.0 25.8
1995 34.8 39.3 25.9
Older Spouse A
g
e 45-54
1969 19.5 31.7 48.8
1979 21.0 38.7 40.2
1989 31.0 40.8 28.2
1995 33.8 40.4 25.8
Older Spouse A
g
e 55-64
1969 19.3 25.4 55.2
1979 17.8 27.0 55.2
1989 21.4 32.6 46.0
1995 25.8 32.1 42.1
SOURCE: Congressional Budget Office tabulations of data from the March Current Population Surveys for 1970, 1980, 1990, and 1996.
NOTE: Working-age married couples include only those in which both spouses are between ages 25 and 64, neither spouse has negative earnings,
and at least one spouse has positive earnings.

44 FOR BETTER OR FOR WORSE: MARRIAGE AND THE FEDERAL INCOME TAX June 1997
valid if families with children typically have only one
earner. That situation was common in the past but defi-
nitely does not prevail today. In 1969, nearly one-half
of all families with children were headed by couples
with just one earner; by 1995, that share had fallen
below one-fifth, whereas the fraction headed by two-
earner couples had risen above one-half (see Table 17).
Over the same period, the fraction of families with chil-
dren headed by a single parent more than doubled, from
13 percent to 30 percent. In view of such major demo-
graphic changes, equal tax treatment of one- and two-
earner couples cannot be justified on the basis of aiding
children. If the tax system has as one objective the fa-
vorable tax treatment of families with children, the tax
code can better offer such benefits directly through
higher exemptions or credits for children. Preferential
tax treatment of single-parent families, however, as
provided by the head-of-household filing status, might
offer reasonably well-targeted assistance to families
with children. Even so, a subsidy offered directly to
families with children would almost certainly provide a
more effective form of assistance.
Table 15.
Percenta
g
e of Workin
g
-A
g
e Married Couples
with Two Earners, b
y
Number of Children in
1969, 1979, 1989, and 1995
Two
No One or More All
Year Children Child Children Couples
1969 53.0 53.3 43.2 48.3
1979 59.9 65.0 56.4 59.6
1989 70.4 75.9 67.2 70.5
1995 71.6 76.9 69.1 71.8
SOURCE: Congressional Budget Office tabulations of data from
the March Current Population Survey for 1970, 1980,
1990, and 1996.
NOTE: W orking-age married couples include only those in which
both spouses are between ages 25 and 64, neither spouse
has negative earnings, and at least one spouse has positive
earnings.
Overview
Two complementary trends emerged over the last quar-
ter century: there were more working-age couples with
two earners and greater parity of earnings between hus-
bands and wives. Those trends occurred in all earnings,
age, and child categories, but were concentrated more
among couples with higher earnings, in younger age
groups, and with children. The patterns should have
given more couples marriage penalties and fewer cou-
ples bonuses, simply because penalties occur more fre-
quently for two-earner couples with a more equal divi-
sion of earnings between husband and wife than for
those whose earnings are less equally divided. The
trends in earnings since 1969 have made marriage pen-
alties more likely for all couples, particularly for those
with high earnings, those with both spouses under age
55, and those with children. At the same time, the
sharp decline in all categories in the proportion of one-
earner couples has meant a corresponding drop in the
number of couples benefiting from marriage bonuses,
which go to virtually all couples with one earner and
occur more frequently for couples who have a less
equal division of earnings.
An estimate of the effect of demographic and
earnings changes since 1969 on marriage penalties and
bonuses can be obtained by superimposing the 1969
distribution of married couples and their earnings on
the projected 1996 distribution and comparing the size
and incidence of penalties and bonuses under 1996 tax
law (see Table 18; statistics in the following discussion
include only working-age couples with some earnings).
Thus, if married couples in 1996 had work and earnings
patterns similar to those of their counterparts in 1969,
the fraction of couples incurring marriage penalties
would be markedly lower 30 percent compared with
47 percent and the fraction receiving bonuses would
be much higher 64 percent rather than the actual 48
percent. Those estimates support the conclusion that
labor market and demographic changes over the last
quarter century have increased the likelihood that cou-
ples will incur marriage penalties.

CHAPTER FOUR LABOR MARKET AND DEMOGRAPHIC CHANGES AFFECTING MARIAGE PENALTIES AND BONUSES 45
Table 16.
Percenta
g
e Distribution of Workin
g
-A
g
e Married Couples, b
y
Division of Earnin
g
s Between
Spouses and Number of Children in 1969, 1979, 1989, and 1995
Both Spouses Had
Each Spouse Earnin
g
s and One Spouse
Earned at Least Contributed More
One-Third of Than Two-Thirds of Onl
y
One Spouse
Year Couple's Earnin
g
s Couple's Earnin
g
s Had Earnin
g
s
All Couples
1969 17.2 31.2 51.7
1979 22.2 37.4 40.4
1989 30.9 39.5 29.5
1995 33.9 37.9 28.2
No Children
1969 24.4 28.6 47.0
1979 27.0 32.9 40.1
1989 34.3 36.2 29.6
1995 36.3 35.3 28.4
One Child
1969 19.3 34.1 46.7
1979 24.6 40.4 35.0
1989 34.9 41.1 24.1
1995 37.6 39.4 23.1
Two or More Children
1969 11.3 31.9 56.8
1979 16.3 40.1 43.6
1989 25.0 42.2 32.8
1995 29.2 39.9 30.9
SOURCE: Congressional Budget Office tabulations of data from the March Current Population Surveys for 1970, 1980, 1990, and 1996.
NOTE: Working-age married couples include only those in which both spouses are between ages 25 and 64, neither spouse has negative earnings,
and at least one spouse has positive earnings.
Additional evidence of the effects of changing earn-
ings and demographics comes from the work of econo-
mists James Alm and Leslie Whittington, who found a
general rise since 1970 in the percentage of couples
incurring a marriage tax. Using both different as-
2
sumptions and data from those of the analysis dis-
cussed in Chapter 3, Alm and Whittington concluded
that the share of couples incurring penalties rose from
less than 40 percent in 1970 to nearly 60 percent in
1994, whereas the fraction receiving bonuses fell from
50 percent to less than 30 percent. Among couples in-
curring penalties, the average penalty rose through the
1970s from about $600 to more than $1,800 (in 1994
dollars) before falling to $1,000 in 1990 and then rising
2. James Alm and Leslie A. Whittington, "The Rise and Fall and Rise ...
of the Marriage Tax,"
National Tax Journal
, vol. XLIX, no. 4
(December 1996), pp. 571-589.

46 FOR BETTER OR FOR WORSE: MARRIAGE AND THE FEDERAL INCOME TAX June 1997
Table 17.
Percenta
g
e Distribution of Families with Children,
b
y
T
y
pe and Number of Earners in Married
Couples in 1969, 1979, 1989, and 1995
One-Earner Two-Earner Sin
g
le-
Married Married Parent
Year Couples Couples Families
1969 44.6 41.1 12.9
1979 29.8 46.9 21.1
1989 21.0 51.4 25.1
1995 18.7 50.2 29.6
SOURCE: Congressional Budget Office tabulations of data from
the March Current Population Surveys for 1970, 1980,
1990, and 1996.
NOTE: Married couples with zero or negative earnings are excluded.
again to $1,200 in 1994. Bonuses followed a similar
pattern, rising from nearly $800 in 1971 to more than
$1,600 in 1980 and then falling to just over $1,000 by
1994.
The Alm and Whittington analysis further demon-
strates that changes in earnings and demographic char-
acteristics have led to larger marriage penalties. One
simulation held tax law constant and found that
changes in the earnings of couples have caused the av-
erage effect of marriage on income tax liabilities to
change from a bonus of between $600 and $800 in
1970 to a penalty of $400 in 1994 (all in 1994 dollars).
An alternative simulation holding the makeup of the
population fixed at 1992 levels demonstrated that al-
though changes in tax law have caused average penal-
ties to vary widely over the past two decades between
more than $600 in the early 1970s to just over $200 in
the late 1980s
those changes alone have not increased
the likelihood that couples will incur penalties. Al-
though the Alm and Whittington analysis relies on dif-
ferent assumptions and data than does this study, it pro-
vides support for the conclusion that changing earnings
patterns and demographics have made marriage penal-
ties more common.
Table 18.
Simulated Effects of Demo
g
raphic Chan
g
e on
Marria
g
e Penalties and Bonuses, 1969 and 1996
Simulated Estimated
1969 1996
Percenta
g
e of Returns
with One Earner 57 38
Percenta
g
e of Earnin
g
s
Goin
g
to One-Earner
Couples 52 30
Percenta
g
e of
Returns with:
Penalt
y
30 47
Bonus 64 48
Neither penalt
y
nor bonus 6 5
SOURCE: Congressional Budget Office simulations based on data
from the 1993 Statistics of Income and the March Cur-
rent Population Surveys for 1970 and 1996.
NOTE: Estimates for 1969 were calculated by superimposing the
distribution of working-age couples by age and division of
earnings between husband and wife on measures of mar-
riage penalties and bonuses projected for 1996. The simu-
lations for 1969 thus implicitly assume that 1996 tax law
would apply to the 1969 distribution of married couples.

R
Chapter Five
Reducing Marriage Penalties
ecent growth in the size of marriage penalties
and the number of couples who are subject to
them has renewed interest in the effect of joint
filing on the taxes people pay. There are several ap-
proaches to the problem.
1
At one extreme lie minor changes within the current
tax system, including tax credits to offset the penalty,
changes in tax brackets and standard deduction levels,
or reenacting the two-earner deduction. For low-
income families, changing the structure of the earned
income tax credit could reduce perhaps to zero the
marriage penalties that it generates. Such proposals
would reduce the impact of the penalties but not elimi-
nate them.
At the other extreme is a reversion to the situation
that existed before 1948, in which all individuals had to
file single tax returns and pay taxes on their own in-
come. That change would totally eliminate the mar-
riage penalty but also get rid of bonuses and impose a
large redistribution of tax burdens among married cou-
ples. An intermediate approach allowing couples to
elect either joint, single, or, if appropriate, head-of-
household filing status would remove penalties but
leave bonuses in place, thus causing substantial revenue
losses and complicating the tax system. Finally, pro-
posals to replace the current income tax with either a
simpler tax on incomes or some form of consumption
tax would change the existing pattern of penalties and
bonuses in ways that will be apparent only after the
plans for reform are more specific.
Any change in the tax system for the purpose of
reducing or eliminating marriage penalties must con-
front a basic trade-off. Because marriage penalties
mean that many couples pay higher taxes than they
would if they were not required to file as a couple, low-
ering the penalties requires either that taxes on single
and head-of-household filers be raised or that taxes on
joint filers be cut. The former approach would almost
certainly bring complaints from those not filing jointly
that the tax laws again discriminated against them with
a new "singles penalty." The latter approach would
reduce tax revenues unless other changes make up for
the loss. Furthermore, the more it reduced penalties,
the greater would be the revenue loss. Changes that
reduce marriage penalties without incurring revenue
losses must redistribute the burden of taxes away from
couples now incurring penalties and toward other tax-
payers namely, either couples now receiving bonuses
or unmarried taxpayers. That basic trade-off limits
what the different options can accomplish.
A final issue concerns the relationship between
marriage penalties and bonuses. Changes in the tax
code that reduce penalties are generally blunt instru-
ments that affect all joint filers, whether they incur bo-
nuses or not. As a result, they tend not only to reduce
penalties but to increase existing bonuses and create
new ones. One important measure of the efficiency of
policies to lower penalties involves the extent to which
they also raise bonuses.
1. Jonathan Barry Forman offers a range of options in "What Can Be
Done About Marriage Penalties?"
Family Law Quarterly
, vol. 30, no.
1 (Spring 1996), pp. 1-22.

48 FOR BETTER OR FOR WORSE: MARRIAGE AND THE FEDERAL INCOME TAX June 1997
Box 7.
Setting Tax Brackets and Standard Deductions for Joint Filers to Twice Those for Single Filers
Simulations of the option setting tax brackets and stan-
dard deductions for joint filers equal to twice those for
single filers assumed that the 28 percent, 31 percent,
and 36 percent tax brackets for joint filers start at tax-
able incomes twice those for single filers. Doubling the
current starting point for the 39.6 percent bracket was
considered too extreme, however. Instead, the lower
end of that bracket for 1993 was taken to be 1.67 times
the appropriate starting point for single filers. Thus, the
simulation took the start of the 39.6 percent bracket for
single filers for 1993 to be $150,000, doubled that to
obtain a new 39.6 percent bracket starting income for
joint filers for 1993, and indexed both values forward to
1996. The resulting starting points for the top tax
bracket were thus assumed to be $158,250 for single
filers and $316,500 for joint filers. Those values com-
pare with $263,750 for both filing statuses under cur-
rent law. Furthermore, the simulations assumed bracket
starting points for heads of household halfway between
those for single and joint filers.
Simulations assumed standard deductions for the
three filing statuses of single filers, $4,000; heads of
household, $6,000; and joint filers, $8,000, compared
with $4,000, $5,900, and $6,700, respectively, under
current law.
The tax brackets used in the simulations were as fol-
lows:
Lowest Taxable Income for Tax Rates (In dollars)
Tax Rate Single Filers Head of Household Joint Filers
(Percent) Current Simulated Current Simulated Current Simulated
15 00 00 00
28 24,000 24,000 32,150 36,000 40,100 48,000
31 58,150 58,150 83,050 87,225 96,900 116,300
36 121,300 121,300 134,500 181,950 147,700 242,600
39.6 263,750 158,250 263,750 237,375 263,750 316,500
SOURCE: Congressional Budget Office.
If different options affect taxpayers in different
parts of the income distribution, combining options
could serve to spread the benefits of change more
equally among couples who are currently penalized.
For example, widening tax brackets and raising the
standard deduction for joint filers reduces penalties pri-
marily for couples who have incomes above $50,000,
whereas revising the EITC affects low-income couples
most. Combining the two options would reduce penal-
ties for the entire income distribution. Even so, couples
currently incurring marriage penalties would receive
varying degrees of relief. Furthermore, because options
may interact with each other, the effects of combining
two of them would not equal the sum of their individual
effects. Many combinations of options are possible.
The following analysis, however, considers only indi-
vidual options.
Widen Tax Brackets and Raise
the Standard Deduction for
Joint Filers
The cause of marriage penalties for many middle- and
high-income couples is that joint filers face tax brackets
that are less than twice as wide as those for single filers
and a standard deduction less than twice that for sin-
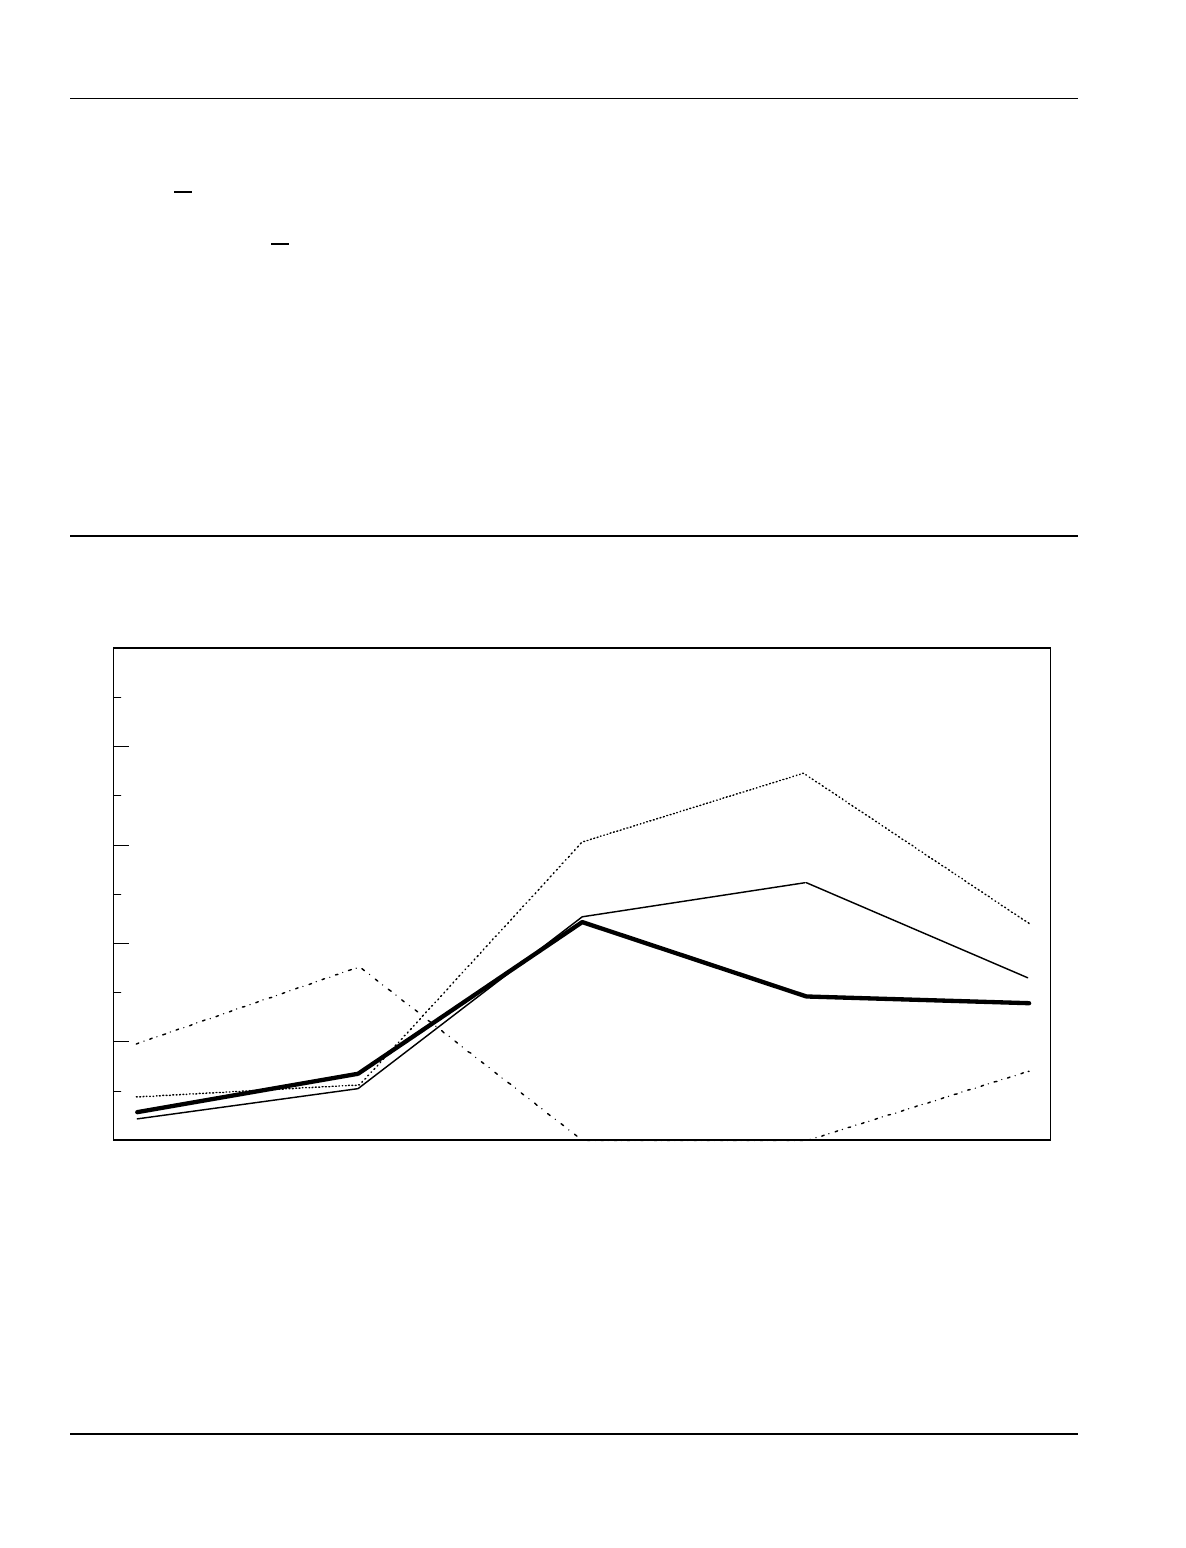
Under $20,000 $20,000-$50,000 $50,000-$100,000 Over $100,000
0
20
40
60
80
100
Adjusted Gross Income
Percentage of Marriage Penalty Removed
All
Families
Widen Brackets
($25 billion)
Expand EITC
($4 billion)
Two-Earner
Deduction
($9 billion)
Credit Against
Tax
($10 billion)
CHAPTER FIVE REDUCING MARRIAGE PENALTIES 49
gles. For example, in 1996 the 15 percent tax bracket
for joint filers applied to the first $40,100 of their tax-
able income 1.67 times the $24,000 first bracket for
single filers. Similarly, the 1996 standard deduction for
joint filers was $6,700 or 1.68 times that for single
filers. Because the ratios are less than two, married
couples in which husband and wife have roughly equal
incomes pay higher taxes than they would if they were
not married. Widening the tax brackets to twice the
width of single brackets and setting the joint standard
deduction to twice that for singles would eliminate that
source of marriage penalties. At the same time, how-
ever, it would create new marriage bonuses for many
couples and increase those for most couples now re-
ceiving them.
An alternative approach to reducing marriage pen-
alties would be to make standard deductions and tax
brackets for single filers equal to one-half of those cur-
rently available to joint filers. Parameters for heads of
household would be set midway between the two. Such
changes would increase the taxes of single and head-of-
household filers and thus increase federal tax revenues.
Because the incomes of such filers are generally lower
than those of joint filers, the revenue impact of the
change would be smaller.
Fi
g
ure 7.
Pro
j
ected 1996 Marria
g
e Penalt
y
Relief Under Alternative Proposals, Basic Measure of Marria
g
e Penalt
y
SOURCE: Congressional Budget Office projections based on data from the 1993 Statistics of Income.
NOTES: The basic measure of penalty and bonus assumes that income is divided between spouses based on the division of earnings; itemized
deductions are divided in proportion to income; childless couples file two single returns; in couples with one child, the higher-earning
spouse files as head of household and the lower-earning spouse files as single; in couples with two or more children, both spouses file as
head of household and the higher-earning spouse claims all but one child; and all filers claim earned income tax credit (EITC) if eligible.
The 1996 revenue cost of each proposal is shown in parentheses.
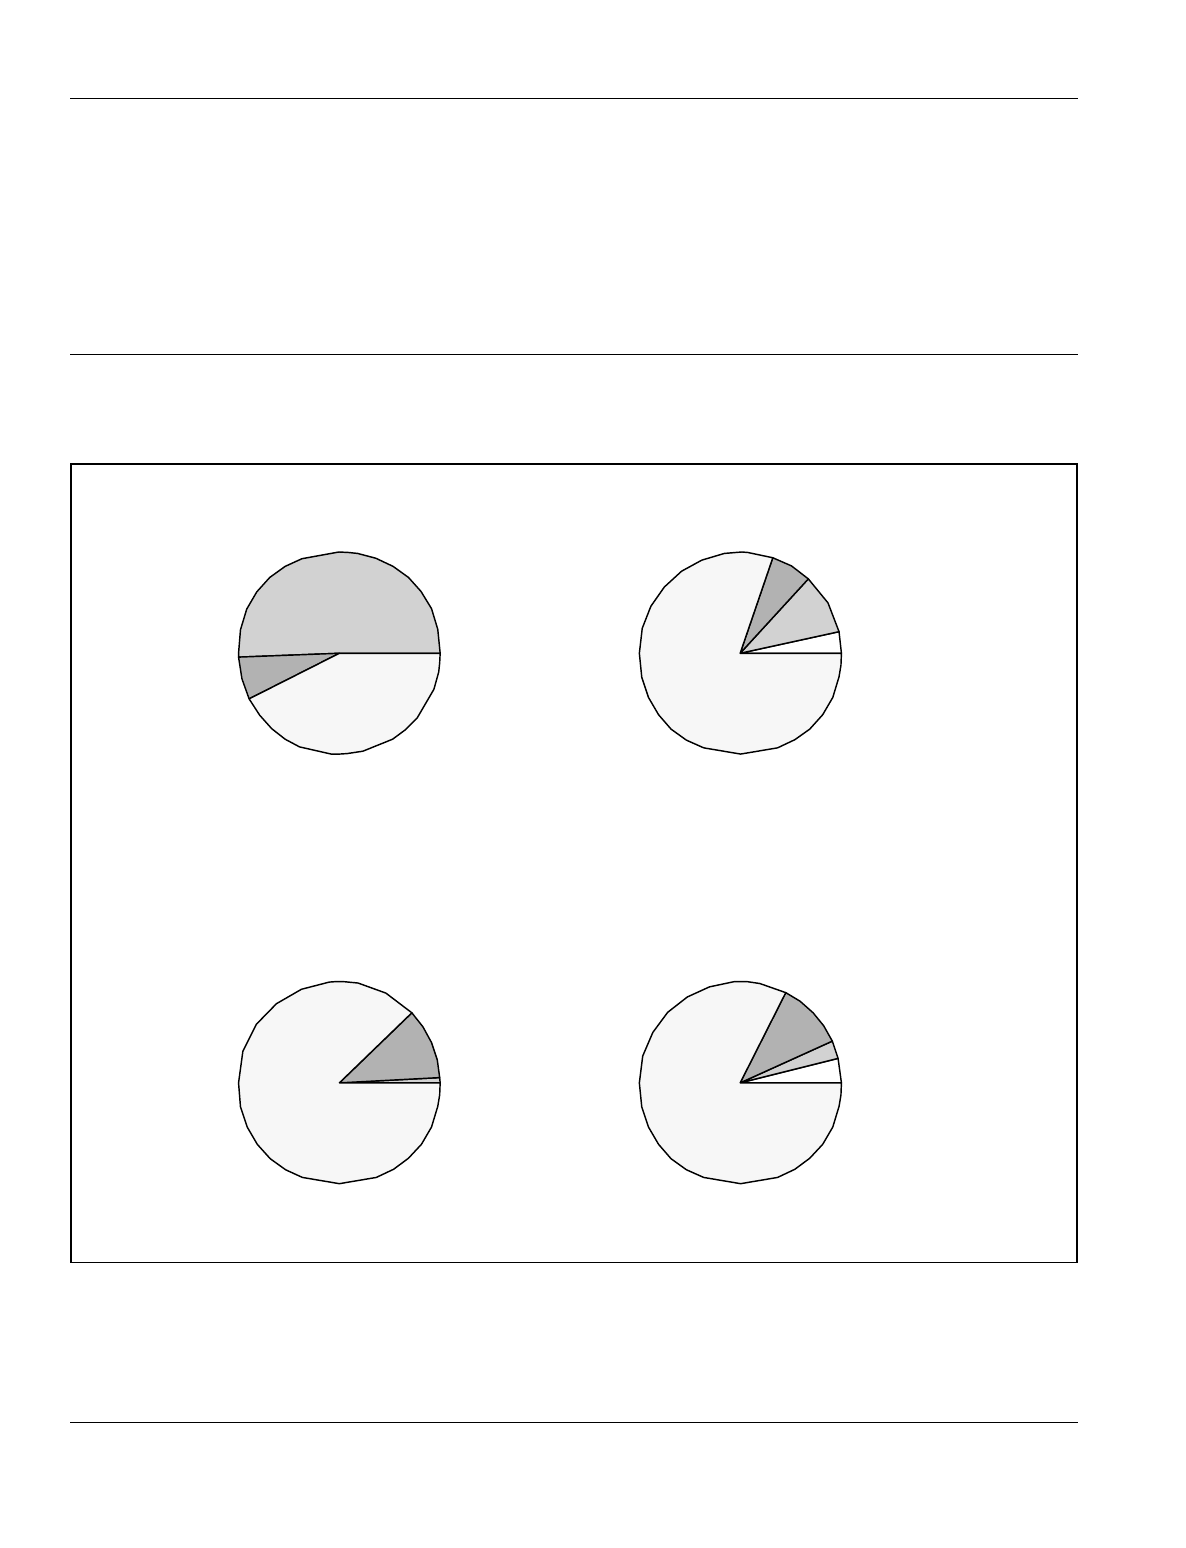
Widen Tax Brackets Two-Earner Deduction
Expand EITC Credit Against Tax
51 Percent to Couples
with Bonuses
7 Percent in Excess
of Penalty
43 Percent Offsettin
g
Penalties
80 Percent Offsettin
g
Penalties
10 Percent to Couples
with Bonuses
7 Percent in Excess of Penalty
3 Percent to
Unaffected Couples
4 Percent to
Unaffected Couples
3 Percent to Couples
with Bonuses
11 Percent in Excess of Penalty
82 Percent Offsettin
g
Penalties
88 Percent Offsettin
g
Penalties
11 Percent in Excess
of Penalty
1 Percent to
Couples with
Bonuses
50 FOR BETTER OR FOR WORSE: MARRIAGE AND THE FEDERAL INCOME TAX June 1997
Setting tax brackets and standard deductions for
joint filers at twice those of single filers would reduce
federal tax revenues by an estimated $25 billion mea-
sured at 1996 income levels (see Box 7 on page 48 for
details of this option). The tax reduction would be
shared almost equally between couples now incurring
marriage penalties and those currently receiving bo-
nuses. On the whole, the changes would reduce mar-
riage penalties by 44 percent (see Figure 7 on page 49).
That reduction would go primarily to couples with in-
comes above $50,000, whose total penalty would fall
by two-thirds; lower-income taxpayers would have their
penalties reduced by just over one-tenth. At the same
time, because their top tax bracket would begin at a
Fi
g
ure 8.
Pro
j
ected 1996 Tar
g
et Efficienc
y
of Alternative Proposals to Relieve Marria
g
e Penalties,
Basic Measure of Marria
g
e Penalt
y
SOURCE: Congressional Budget Office projections based on data frzom the 1993 Statistics of Income.
NOTE: The basic measure of the penalty and bonus assumes that income is divided between spouses based on the division of earnings; itemized
deductions are divided in proportion to income; childless couples file two single returns; in couples with one child, the higher-earning spouse
files as head of household and the lower-earning spouse files as single; in couples with two or more children, both spouses file as head of
household and the higher-earning spouse claims all but one child; and all filers claim the earned income tax credit (EITC) if eligible.

CHAPTER FIVE REDUCING MARRIAGE PENALTIES 51
lower taxable income than under current law, high-
income taxpayers filing singly or as heads of household
would pay an additional $140 million in taxes.
Reducing marriage penalties by widening tax
brackets and increasing the standard deduction for joint
filers is highly inefficient because one-half of the reve-
nue cost to the government would go to couples already
receiving marriage bonuses (see Figure 8). Further-
more, more than five-sixths of the roughly $13 billion
in reduced taxes for current bonus recipients would go
to couples with incomes above $50,000, who incur less
than two-thirds of all current penalties.
Setting tax brackets and standard deductions for
joint filers at twice those for single filers would largely
return the tax bracket relationships to what they were
before 1969. As indicated in the historical discussion
above, the Congress changed the tax code in 1969 to
reduce the "singles penalty," the higher taxes that many
taxpayers incurred because they were not married.
Changes made that year drew a compromise between
marriage and singles penalties, creating the former in
the process of reducing the latter. Reversing that action
could rekindle the complaints of single filers that the
tax code discriminates against them. Even if changes
left their taxes unaffected, single filers might object that
lowering the taxes of married couples would leave sin-
gles worse off in relative terms, again paying higher
taxes because they are single than they would if they
were married.
Exem
p
t from Taxes Some
Income of Lower-Earnin
g
S
p
ouse
One cause of marriage penalties is that the first dollar
of taxable income of the lower-earning spouse is taxed
at the marginal tax rate of the higher-earning spouse.
Although the wider tax brackets for joint filers reduce
the taxes paid on the higher-earning spouse's income,
the higher initial tax rate faced by the lower-earning
spouse creates a disincentive for that spouse to work at
all. Furthermore, it results in a marriage penalty if that
spouse earns a large enough share of the couple's total
income. Exempting part of the lower-earning spouse's
income from taxation would alleviate this problem.
One approach to such an exemption would be to restore
the second-earner deduction.
Between 1982 and 1986, two-earner couples were
allowed to deduct from taxable income 10 percent (5
percent in 1982) of the earnings of the lower-earning
spouse, up to a maximum of $3,000. The Tax Reform
Act of 1986 eliminated the provision, in part because
other changes in the tax law had reduced the size of
marriage penalties, but also to offset the act’s revenue
losses. Restoring the two-earner deduction would re-
duce or eliminate the marriage penalty for many cou-
ples. For example, a couple with one spouse earning
$30,000 and the other earning $20,000 would be
shifted from incurring a $195 penalty to receiving a
$105 bonus (see Box 8). Overall, restoring the deduc-
tion would lower the total marriage penalty levied in
1996 by roughly one-third at an estimated cost of $9
billion in lost revenues.
The relief provided by the two-earner deduction
would be greatest for couples with incomes between
$50,000 and $100,000, for whom marriage penalties
would fall by nearly one-half. By contrast, couples at
the bottom of the income distribution would gain an
average of less than one-tenth of their current marriage
penalties, largely because their penalties arise from the
standard deduction and the earned income tax credit,
whereas the two-earner deduction reduces penalties de-
riving from the tax brackets. Because of the $3,000
limit on the deduction, couples at the top of the income
distribution would recoup only one-third of their current
penalties.
The two-earner deduction would benefit not only
couples currently incurring marriage penalties but also
many families now in a bonus position. For example, a
two-earner childless couple in which the lower-earning
spouse earns $5,000 of the couple's $50,000 in earn-
ings would pay $75 less in 1996 taxes because of the
deduction, even though they would already receive a
marriage bonus of more than $1,900. About one-fifth
of all couples who currently receive bonuses would ben-
efit from the two-earner deduction with average tax
savings of about $170. As a consequence, 20 percent
of the revenues lost because of the deduction would
increase existing bonuses or create new ones (see Fig-
ure 8). Just one-half of this amount would go to cou-
ples now receiving bonuses. About one-sixth of that

52 FOR BETTER OR FOR WORSE: MARRIAGE AND THE FEDERAL INCOME TAX June 1997
Box 8.
The Two-Earner Deduction
A couple with $50,000 in total earnings
$30,000
earned by the husband and $20,000 by the wife
would
have incurred a marriage penalty of $195 under 1996
tax law. The penalty results from a smaller standard
deduction under joint filing than under individual filing.
If the couple could also have claimed a two-earner de-
duction equal to 10 percent of the wife's earnings, their
taxable income would have been reduced by $2,000 (10
percent of $20,000), their tax liability would have fallen
by $300 (15 percent of $2,000), and their $195 mar-
riage penalty would have become a bonus of $105.
Couple
With
Under Two-Earner
Husband
Wife Current Law Deduction
Adjusted Gross Income $30,000 $20,000 $50,000 $50,000
Less personal exemptions 2,550 2,550 5,100 5,100
Less standard deduction 4,000 4,000 6,700 6,700
Less two-earner deduction 0 0 0 2,000
Equals taxable income 23,450 13,450 38,200 36,200
Taxable at 15 percent 23,450 13,450 38,200 36,200
Tax Liability 3,518 2,018 5,730 5,430
Marriage Penalty (+) or Bonus (-) $195 -$105
As a Percentage of Adjusted Gross Income 0.4 -0.2
SOURCE: Congressional Budget Office.
amount would go to the roughly 1 million couples now
neither paying penalties nor receiving bonuses who
would also benefit from the two-earner deduction. The
final one-third would go to couples incurring penalties
but would exceed the amount of penalty they pay.
Restoring the two-earner deduction could induce
some married couples to change whether and how much
they work. Depending on the earnings of the lower-
earning spouse, the change would affect couples in one
of three ways. First, for one-earner couples, the deduc-
tion would lower the marginal tax rate that nonworking
spouses would face if they entered the labor force and
would thus increase their after-tax wages. That in-
crease could induce them to go to work.
Second, two-earner couples in which the lower-
earning spouse earned less than $30,000 and thus for
whom the $3,000 cap would not limit the deduc-
tion would experience a similar increase in the after-
tax wages of lower-earning spouses, which could lead
them to work more hours. At the same time, however,
because the deduction would raise the couple's after-tax
income even if neither spouse changed hours of work,
such a couple would want to work less. The two in-
ducements offset one another and the net effect on labor
supply is indeterminate.
Finally, the deduction would increase the after-tax
income of two-earner couples whose spouses both earn
more than $30,000, but would have no effect on their

CHAPTER FIVE REDUCING MARRIAGE PENALTIES 53
after-tax wage rate because additional earnings would
not generate additional deductions. Those couples
would tend to work fewer hours because of the gain in
income and would have no offsetting effect of higher
net wages. The total effect on the labor supply of re-
storing the two-earner deduction could be up or down,
depending on the relative numbers of those three types
of couples and how much each would change its work
patterns.
Modif
y
Earned Income Tax
Credit to Reflect Number of
Adult Earners
Low-income families with children can incur significant
marriage penalties because of limits on the earned in-
come tax credit. If both husband and wife work, the
phaseout of the EITC on the basis of their combined
income can lead to the loss of some or all of the EITC
to which one of them might be entitled individually.
(See Box 5 for an example in which the loss of EITC
benefits would cost a couple one-eighth of their pretax
income, compared with what would happen if they
could file as single taxpayers.) Modifying the EITC to
take account of whether one or both spouses work
would alleviate this marriage penalty.
A wide range of options for modifying the EITC to
provide larger credits for two-earner couples could re-
duce marriage penalties but would also encounter prob-
lems of cost and complexity. At one extreme, each par-
ent could receive the EITC on the basis of the current
credit parameters and their earnings and total incomes.
That liberalization would remove completely any mar-
riage penalties associated with the EITC, but would
eliminate the existing limits on family income for re-
ceiving the credit, reduce federal revenues and increase
spending by a total of about $14 billion in 1996, and
grant EITC to more than 11 million families not now
eligible for the credit. Couples in which one spouse had
earnings low enough to qualify for the EITC under cur-
rent credit parameters would receive the credit, regard-
less of how much the other spouse earned. As a result,
one-third of the tax reduction would go to couples with
incomes above $50,000.
Modifying that approach to phase out individual
credits based on family rather than individual income
but setting higher levels for couples would limit the
credit to lower-income families and hold down revenue
losses. Each spouse would be entitled to an EITC
based on individual earnings, but the couple's EITC
would be reduced by a percentage of the amount by
which their total income exceeds a given level. The rate
of reduction and the income above which it becomes
effective would determine the maximum income a fam-
ily could have without losing the credit entirely. For
example, if couples were limited to collecting EITC
only if their total adjusted gross income were less than
twice the current limits, the combined revenue loss and
spending increase would drop to about $10 billion in
1996, only 10 percent of which would go to couples
with incomes above $50,000.
Both revenue losses and spending increases would
be smaller under an alternative that set EITC parame-
ters for couples equal to twice those for single and
head-of-household tax filers. That option would effec-
tively require spouses to share earnings equally and
then qualify for the EITC as individuals using the cur-
rent credit parameters. Compared with the previous
approach, this option would reduce the amount of EITC
going to couples in which husband and wife have sub-
stantially different incomes. Combined revenue losses
and spending increases would have totaled nearly $4
billion in 1996, virtually all of which would have gone
to couples with incomes below $50,000. Marriage pen-
alties resulting from the EITC would decline or disap-
pear for about one-third of couples currently penalized,
reducing those penalties by about one-fourth. The ap-
proach would be highly effective in targeting couples
now incurring EITC marriage penalties; less than 1 per-
cent of total revenue losses and spending increases
would go to couples currently receiving EITC marriage
bonuses. Couples with incomes between $20,000 and
$50,000 would receive about 90 percent of the mar-
riage penalty relief, and almost all of the rest would go
to couples with incomes below $20,000. As would be
the case for each of the previous EITC options, this
approach would extend the credit to couples with in-
comes far above current limits $28,495 in 1996.
More than 3.7 million couples would become newly
eligible for the EITC.
More restrictive liberalizations of the EITC could
ease the marriage penalties created by the credit while

54 FOR BETTER OR FOR WORSE: MARRIAGE AND THE FEDERAL INCOME TAX June 1997
generating smaller total revenue losses and spending
increases and without extending the credit to high-in-
come couples. The more restrictive the changes, how-
ever, the fewer couples now penalized would get relief
and the smaller the fraction of current penalties would
be removed. Granting the credit to couples based on
individual earnings but phasing the credit out more
quickly than under current law would hold down reve-
nue losses, but would be much less effective in reducing
marriage penalties and the disincentives for low-income
people to marry and work.
An alternative to modifying the EITC would be
replacing it with a taxable child allowance. If the al-
lowance was available to all taxpayers with children,
receipt would be unaffected by marriage and the allow-
ance would generate neither penalties nor bonuses. Al-
though making child allowances taxable would main-
tain progressivity, extending them to all families, re-
gardless of income, would require markedly increasing
outlays or reducing benefits to low-income families
substantially below current levels of the EITC. In any
case, this alternative would involve major changes in
the nature of the redistribution currently accomplished
by the EITC.
Restore the Re
q
uirement That
S
p
ouses File Individual
Returns
Before 1948, the individual income tax imposed no
marriage penalties because husbands and wives had to
file their own individual returns. Although shifting to a
joint filing requirement might have fit the times when
most couples had just one worker, the preponderance of
two-earner couples in the 1990s may call for a return to
individual taxation. Such a change would not only re-
move all marriage penalties but would also eliminate
marriage bonuses. The net effect would be a shift in
the burden of income taxes away from two-earner cou-
ples and toward one-earner couples.
By eliminating differences in couples' tax liabilities
brought about by marriage, the change would improve
the fairness of the tax system between married couples
and otherwise similar pairs who are not married and
reduce the disincentives to work caused by joint income
taxation with progressive rates. Revenue gains from
removing marriage bonuses would more than offset
revenue losses resulting from the elimination of penal-
ties and would raise net federal revenues by an esti-
mated $4 billion measured at 1996 income levels. That
revenue gain assumes that, if eligible, each spouse
could file as a head of household and claim the EITC.
Denying either of those options would generate greater
revenue gains.
Requiring individual filing would, however, cause a
large redistribution of tax liabilities from those now in-
curring penalties to those now receiving bonuses. As-
suming that there would be no changes in marital status
or earnings because of the changed tax law, nearly 21
million couples now incurring penalties would save an
average of nearly $1,400 in taxes, and another 25 mil-
lion couples currently benefiting from bonuses would,
on average, pay about $1,300 more in taxes than they
do under current law.
Requiring all people to file individual tax returns
would mean that couples with identical incomes but
different divisions of those incomes between husband
and wife would pay different taxes, an outcome that
some people would view as unfair. Differences in the
way couples earn their incomes may, however, warrant
varying levels of taxes. A couple in which only one
spouse works is better off than a two-earner couple
with the same income if the first couple's nonworking
spouse is free to provide services that the second couple
might have to purchase. Taxing couples on the basis of
their ability to pay would require that the first couple
pay more in taxes than the second, which is what would
happen under a system of individual taxation.
At the same time, taxing one-earner couples more
than two-earner couples with the same dollar income
could be considered antifamily because it could induce
more couples to have two earners and thus require child
care facilities outside the family. Furthermore, two
couples in which all spouses work full time could have
markedly different divisions of income between hus-
band and wife and therefore pay different amounts of
income tax, even though both their time and monetary
resources would be identical. Only by further com-
plicating the tax code, however, could the Congress

CHAPTER FIVE REDUCING MARRIAGE PENALTIES 55
eliminate such inequities; even then, additional issues
affecting ability to pay would remain.
Returning to individual filing for married couples
would cause other problems. First, the change would
have offsetting effects on work incentives. On the one
hand, by lowering the tax rate imposed on the first dol-
lar earned by a lower-earning spouse, the shift would
reduce the work disincentives created by the tax system.
On the other, the marginal tax on the income of the
higher-earning spouse could be raised, imposing work
disincentives that could lead to a reduction in the num-
ber of hours that spouse would work. The net effect is
ambiguous.
A second issue involves the conflict between indi-
vidual filing requirements and state community prop-
erty laws. As noted earlier in the historical discussion,
community property states hold that a couple's income
is divided evenly between husband and wife, therefore
each spouse should pay taxes on one-half of the cou-
ple's income. Requiring that spouses pay individual
taxes on their own incomes would run afoul of the 1930
Supreme Court decision affirming that couples in com-
munity property states can split their total incomes
evenly for tax purposes. A return to mandated individ-
ual filing would have to deal with the community prop-
erty issue.
Finally, individual filing by spouses would require
rules governing the allocation of jointly received in-
comes and of deductions and exemptions. One ap-
proach would allow couples to divide those items in any
way they wanted, although allowing total freedom
would make tax filing more complicated as couples
tried to determine their tax-minimizing allocations.
Alternatively, the law could require a joint return only
for income received jointly, a practice followed by
many other industrialized countries. That requirement
would raise the costs of complying with the tax code
and would impose additional burdens on the Internal
Revenue Service. Finally, the law could mandate par-
ticular divisions of joint incomes, deductions, and ex-
emptions between spouses, thereby limiting the number
of calculations a couple would have to make but none-
theless complicating the tax code.
Allow Cou
p
les Choice
of Filin
g
Status
Giving couples the choice of filing jointly, as individu-
als, or, if eligible, as heads of household, would elimi-
nate all marriage penalties at the cost of large losses of
revenue. Because spouses could choose to file individ-
ually or as household heads, marriage could not, by it-
self, increase a couple's tax liability. However, allow-
ing joint tax returns would retain current marriage bo-
nuses. Couples receiving bonuses would continue to do
so, whereas those now incurring penalties would shift
to individual or head-of-household returns. In 1996,
this option would have reduced federal tax revenues by
an estimated $29 billion, the total value of all marriage
penalties. Disallowing the option of filing as head-of-
household would decrease the revenue loss. The ap-
proach would also encounter the same difficulties with
dividing joint incomes, deductions, and exemptions be-
tween spouses as the option to require individual filing.
Under a less extreme approach, couples would be
required to file joint returns but would be given, on the
basis of a simplified tax calculation, a credit equal to all
or part of their marriage penalty. Using a simplified
calculation would increase the administrative feasibility
of that option and hold down its costs for example,
counting only earned income and allowing only stan-
dard deductions and personal exemptions. Even so, re-
quiring that a couple seeking relief from marriage pen-
alties prepare two individual tax calculations in addi-
tion to completing their full joint return would impose
significant compliance costs on filers and large ad-
ministrative costs on the Internal Revenue Service.
Furthermore, if the marriage penalty incurred by a cou-
ple does not derive from differences in tax brackets and
standard deductions for single and joint filers, then bas-
ing credits on a simplified tax calculation would not
offset all penalties. For example, the marriage penal-
ties incurred by low-income families with children re-
sult principally from the EITC; only if credit calcula-
tions included the EITC would this approach provide
significant relief from marriage penalties for low-
income families.

56 FOR BETTER OR FOR WORSE: MARRIAGE AND THE FEDERAL INCOME TAX June 1997
A credit based only on earnings, standard deduc-
tions, personal exemptions, and joint-versus-single fil-
ing statuses would reduce the total marriage penalty by
about one-third at a cost of about $10 billion in forgone
revenues. Because it would offset most of the penalties
deriving from tax brackets, this approach would lower
penalties most for higher-income families; on average,
couples with incomes above $50,000 would see their
marriage penalties fall by more than one-half.
Conversely, because the credit would not take the
EITC into account the major cause of marriage penal-
ties for low-income couples families with incomes
below $20,000 would have less than one-tenth of their
penalty removed. In addition, some couples currently
receiving marriage bonuses would qualify for a credit.
Roughly one-sixth of the total credit would increase
existing bonuses or create new ones (see Figure 8).
Fundamental Tax Reform
In recent years, calls for a fundamental restructuring of
the federal tax system have increased, ranging from a
flatter income tax to substituting consumption for in-
come as the object of taxation. The precise effects of
any such reforms on marriage penalties depend on the
specific details of the new tax, but it is possible to pre-
dict some general outcomes as a result of particular
kinds of changes.
Flat Taxes
One approach to fundamental tax reform would replace
the current individual income tax with a flat (single
rate) tax on labor and business incomes. Under one
formulation, individual taxpayers could deduct only a
personal allowance defined by tax filing status and a
fixed personal allowance for each dependent before
imposing a single tax rate on the remaining (taxable)
income. Business incomes would be taxed separately.
A flat tax would reduce and possibly eliminate
marriage penalties. Because just one tax rate would
apply, there could be no penalty from tax brackets.
Furthermore, if the tax eliminated the EITC, that credit
would no longer impose marriage penalties. Only dif-
ferences in personal allowances for tax filers would
generate penalties. If the allowance for a single filer
was exactly one-half that for a couple, marriage penal-
ties would occur only if unmarried taxpayers with de-
pendents could file as heads of household with larger
personal allowances than they would receive as single
filers. Other versions of the flat tax that would elimi-
nate all exemptions and deductions beyond personal
allowances would have similar effects
Marriage bonuses would continue under a flat tax if
one spouse was unable to use the full value of personal
allowances to reduce taxable income. Any couple in
which only one member paid positive taxes before mar-
riage would receive a marriage bonus because the pair
could reduce their taxable income by up to the differ-
ence between joint and single personal allowances and
thus pay lower taxes. Only if neither spouse owed any
taxes before marriage or both spouses paid positive
taxes before marriage, and marriage did not change
their total deductions and exemptions, would they nei-
ther incur a marriage penalty nor receive a marriage
bonus.
Retail Sales Taxes and
Value-Added Taxes
Replacing the current individual income tax with a re-
tail sales tax or a value-added tax would eliminate all
marriage penalties and bonuses. Because a retail sales
tax (RST) or a value-added tax (VAT) would tax con-
sumption and involve no personal deductions or exemp-
tions, only differences in levels of consumption would
produce differences in tax liability. Under an RST or
VAT, couples would pay higher or lower taxes after
marriage than before only if their consumption
changed. Marriage itself would have no effect on their
taxes. Most proposals for an RST or a VAT include
provisions for tax relief for low-income families
through either a rebate or an income-based credit. Re-
bates or credits, depending on how they were struc-
tured, could reintroduce marriage penalties and bo-
nuses.

Appendixes


M
Appendix A
Tax Treatment of Married Couples
in Other Countries
ost industrialized countries tax married cou-
ples differently than does the United States.
In 1993, of the 27 countries in the Organiza-
tion for Economic Cooperation and Development
(OECD), 19 imposed income taxes separately on hus-
bands and wives, as the United States did before 1948
(see Box A-1). In those countries, marriage has little
effect on a couple's tax liability on earnings, but cou-
ples with identical incomes can owe substantially dif-
ferent amounts of taxes, depending on the division of
earnings between husband and wife. In general, how-
ever, the 19 countries tax spouses' combined invest-
ment earnings, either at the higher of their marginal tax
rates or through a legally determined division of asset
income between them for tax purposes.
Four countries France, Luxembourg, Portugal,
and Switzerland follow an opposite approach. They
grant marriage bonuses to virtually all families and pro-
vide child bonuses as well. For example, the French
system requires taxpayers to combine all income earned
by parents and their children and then to split the in-
come among all family members. Children are
weighted half as much as parents. Individual tax sched-
ules then apply to each of the split incomes. A couple
with two children would thus pay the same tax rate as a
single person with one-third of their family income.
Under progressive tax rates, such income-splitting
nearly always results in a marriage bonus.
Among the OECD countries, only three tax couples
on their combined incomes as the United States does.
Germany allows complete income-splitting between
spouses, just as the United States did between 1948 and
1969. Because both singles and couples face the same
tax rates, German couples generally receive a marriage
bonus. Ireland and Norway, like the United States, im-
pose taxes on each couple's combined income using
separate tax schedules that mitigate the effects of joint
taxation and can result in marriage penalties or bo-
nuses.
Individual taxation has dominated only since 1970.
Before that year, only six OECD countries taxed
spouses separately. By 1980, seven countries had
shifted away from joint or family taxation to individual
taxation, and three more countries followed suit in 1989
and 1990. In the same period, no countries moved in
the other direction, and any reversal in this pattern is
highly unlikely.
Individual taxation generally applies only to earn-
ings. Countries that require couples to file individual
returns treat property income in one of two ways. Some
countries ignore the division of ownership of assets
between spouses and tax income from all of a couple's
assets as income to the higher-earning spouse. Conse-
quently, the higher marginal tax rate of the spouse who
earns more applies to all property income. Other coun-
tries require a specific division of property income be-
tween spouses, either evenly or in proportion to earn-
ings. The marginal tax rate of each spouse thus applies
to part of the couple's property income. In either case,
legal ownership of assets does not matter in determin-
ing tax liability and couples gain no advantage from
manipulating ownership to minimize their tax bills.

60 FOR BETTER OR FOR WORSE: MARRIAGE AND THE FEDERAL INCOME TAX June 1997
Box A-1.
Tax Treatment of Earned Income in OECD Countries, 1993
Individual Taxation Joint Taxation Family Taxation
a
Australia Germany France
Austria Ireland Luxembourg
Belgium Norway Portugal
Canada United States Switzerland
Czech Republic
Denmark
Finland
Greece
Hungary
Iceland
Italy
Japan
Mexico
Netherlands
New Zealand
Spain
Sweden
Turkey
United Kingdom
SOURCE: Congressional Budget Office, derived from Organization for Economic Cooperation and Development, part IV, "Description of the
Tax/Benefit Systems,"
The Tax/Benefit Position of Production Workers, Annual Report, 1990-1993
(Paris: Organization for Economic
Cooperation and Development, 1994), pp. 107-228.
a. Taxes are based on total income from all family members and composition of family.

T
Appendix B
Treatment of Married Couples Under
State Income Taxes
he states vary widely in the way they tax the
incomes of couples (see Box B-1). Eight states
have no income tax and therefore do not face
the issue. Six additional states impose a single tax rate
on all tax units, regardless of income level or filing sta-
tus. Because marriage does not affect the levels of de-
duction and personal exemption in any of those states,
couples incur no marriage penalties and receive bonuses
only if one spouse has earnings below the level of indi-
vidual exemptions and deductions. The remaining 36
states and the District of Columbia fall into three
groups that treat the taxation of married couples differ-
ently.
States with Joint Return
Rate Schedules
Fifteen states have schedules that reduce or eliminate
any tax penalty on marriage. Eight of those states cre-
ate tax brackets for married couples by doubling the
width of the rate brackets for individual filers, follow-
ing the pattern of the federal schedules used between
1948 and 1969. That approach creates marriage bo-
nuses for virtually all couples. The other seven states
widen but do not double the brackets for married cou-
ples, thereby lowering penalties below what they would
be if couples had to use the rate brackets for individual
filers but leaving marriage penalties in place for some
couples. The last approach mirrors the current federal
income tax, under which the width of tax brackets for
married couples is generally two-thirds larger than that
for single filers.
States Allowin
g
Cou
p
les to
File Se
p
arate Returns
on a Sin
g
le Form
Nine states and the District of Columbia allow hus-
bands and wives to use one return but pay taxes on
their separate incomes as if they were single. Because
couples have the choice of whether to file separately,
they can only face a marriage bonus, which generally
occurs when the earnings of the husband and wife are
substantially different. Such an option was effectively
available on the federal level to couples in community
property states before 1948; couples in those states
could elect either to report their individual incomes or
to divide their total income equally between spouses.
The 10 jurisdictions allowing spouses to file state
tax returns individually on a single form face a prob-
lem namely, how to tax property income. Because of
the ease with which couples can switch ownership of
assets between spouses, at least some of those jurisdic-
tions allow couples to choose the division of income
from jointly owned property between themselves if they
elect to file separately on a single return. Even so, sep-
arate filers must report income from their individually
owned assets as that of the owner. In such cases, cou-

62 FOR BETTER OR FOR WORSE: MARRIAGE AND THE FEDERAL INCOME TAX June 1997
Box B-1.
Treatment of Married Couples Under State Income Taxes, 1993
States with
Joint Rate
Schedules for
States Allowing Married Couples, States in Which States with Flat
Married Couples to Reducing or Married Couples Tax Rates and
File Separately on a Eliminating May Face a Therefore No States with No
Single Tax Return Marriage Penalty Marriage Penalty Marriage Penalty Income Tax
a
Arkansas Alabama Georgia Connecticut Alaska
b
Delaware Arizona Kansas Illinois Florida
b
District of Columbia California Maryland Indiana Nevada
b
Iowa Colorado New Jersey Massachusetts New Hampshire
Kentucky Hawaii New Mexico Michigan South Dakota
b
Mississippi Idaho North Dakota Pennsylvania Texas
bc
Missouri Louisiana Ohio Washington
b
Montana Maine Oklahoma Wyoming
Tennessee Minnesota Rhode Island
c
Virginia Nebraska South Carolina
New York Vermont
c
North Carolina West Virginia
Oregon
b
Utah
b
Wisconsin
SOURCE: Derived from Advisory Commission on Intergovernmental Relations, "Budget Processes and Tax Systems,"
Significant Features of Fiscal
Federalism 1994
, vol. 1 (Washington, D.C.: Advisory Commission on Intergovernmental Relations, June 1994), Tables 16 and 17, pp.
54-62.
a. Standard deductions and exemptions for couples equal the sum of those of spouses filing as individuals and hence do not impose marriage penalties.
b. These states fully eliminate any marriage penalty by allowing married couples to use rate brackets double the width of those available to single
filers.
c. North Dakota, Rhode Island, and Vermont levy state income taxes as a percentage of federal income tax liability and therefore impose marriage
penalties proportional to those at the federal level.
ples could still shift asset ownership to the spouse with
the lower marginal tax rate to minimize their combined
tax liability.
States in Which Cou
p
les Ma
y
Face Marria
g
e Penalties
Twelve states impose marriage penalties and bonuses
similar to those at the federal level. Because North
Dakota, Rhode Island, and Vermont levy taxes as a per-
centage of federal liability, couples filing in those states
face penalties or bonuses proportional to those in the
federal income tax. Couples in other states may incur
marriage penalties because they must use tax schedules
the same as or not very different from those used by
single people. In general, those states require couples
who file joint federal returns also to file joint state re-
turns.

T
Appendix C
Characteristics of Married and
Unmarried Couples, 1995
he Current Population Survey (CPS) provides
data that allow comparison of married couples
and self-identified unmarried couples. Since
1995, the CPS has asked respondents whether they had
unmarried partners and were therefore couples who
were not married but living together in relationships
that have many of the characteristics of marriages. The
March 1996 CPS identified nearly 2.7 million such
couples, 97 percent of which were opposite-sex cou-
ples. The survey also recorded 54.7 million married
couples. Self-identified unmarried couples thus consti-
tuted about 5 percent of all couples.
An alternative method used for many years by the
census to identify unmarried couples defines them as
unrelated adults of opposite sexes living together in a
household with no other adults present. This definition
finds many more unmarried couples than does self-
identification: 3.8 million in March 1996 versus 2.7
million self-identified couples. The number of unmar-
ried couples identified under this definition has in-
creased rapidly over the past quarter century from 0.5
million in 1970 to 1.2 million in 1980, 2.9 million in
1990, and 3.8 million in 1996.
Demo
g
ra
p
hic Differences
As a group, unmarried couples earn lower incomes, are
younger, and have fewer children than married couples.
Unmarried couples had markedly lower incomes in
1995 than their married counterparts: 43 percent of
unmarried couples and 30 percent of married couples
had incomes below $30,000. In the same year, 42 per-
cent of married couples and 30 percent of those not
married had incomes above $50,000 (see Table C-1).
In 1995, one-half of all unmarried couples were
under age 35, compared with only one-fifth of married
couples. At the other end of the age spectrum, one-
third of married couples but less than one-tenth of un-
married couples were 55 years old or older (see Table
C-2).
The two groups were more similar in terms of num-
bers of children: 46 percent of married couples and 42
percent of unmarried couples had children in 1995.
Among those who had children, however, more than 60
percent of married couples had two or more children
compared with less than half of unmarried couples (see
Table C-3).
Differences in Simulated
Marria
g
e Penalties and
Bonuses
Given the differences between married and unmarried
couples, it is not surprising that simulations of marriage
penalties and bonuses for the two groups are dissimilar
(see Table C-4).

64 FOR BETTER OR FOR WORSE: MARRIAGE AND THE FEDERAL INCOME TAX June 1997
Based on the March 1996 CPS, the simulations
indicate that 49 percent of married couples incur penal-
ties and 39 percent have bonuses. By contrast, 56 per-
cent of unmarried couples would bear penalties and 33
percent would receive bonuses if they were required to
file joint tax returns. Estimated average bonuses for the
two groups are similar $1,140 and $1,020 but aver-
age penalties for married couples are more than 50 per-
cent larger than those for their unmarried counter-
parts nearly $1,200 versus about $770. Much of the
difference probably occurs because unmarried couples
as a group have substantially lower incomes than mar-
ried couples.

APPENDIX C CHARACTERISTICS OF MARRIED AND UNMARRIED COUPLES, 1995 65
Table C-1.
Distribution of Married and Unmarried Couples by Total Income, 1995
Less Than $10,000- $20,000- $30,000- $50,000- $75,000- More Than
$10,000 $20,000 $30,000 $50,000 $75,000 $100,000 $100,000 Total
Thousands of Couples
Married 2,400 6,500 7,850 14,610 12,290 5,610 5,390 54,670
Unmarried 190 420 530 740 470 170 150 2,650
a
Percentage of Couples
Married 4121427221010100
Unmarried 716202818 6 6100
a
SOURCE: Congressional Budget Office tabulations of data from the March 1996 Current Population Survey.
a. Unmarried couples are those living together and reporting as partners.

66 FOR BETTER OR FOR WORSE: MARRIAGE AND THE FEDERAL INCOME TAX June 1997
Table C-2.
Distribution of Married and Unmarried Couples by Age of Older Spouse, 1995
Under 65 and All
Age 25 25-34 35-44 45-54 55-64 Over Ages
Thousands of Couples
Married 1,150 9,230 14,290 11,820 8,100 10,070 54,670
Unmarried 350 980 680 400 150 90 2,650
a
Percentage of Couples
Married 21726221518100
Unmarried 13 37 26 15 6 3 100
a
SOURCE: Congressional Budget Office tabulations of data from the March 1996 Current Population Survey.
a. Unmarried couples are those living together and reporting as partners.

APPENDIX C CHARACTERISTICS OF MARRIED AND UNMARRIED COUPLES, 1995 67
Table C-3.
Distribution of Married and Unmarried Couples by Number of Children, 1995
Two or
No One More All
Children Child Children Couples
Thousands of Couples
Married 29,300 9,570 15,800 54,670
Unmarried 1,530 570 550 2,650
a
Percentage of Couples
Married 54 18 29 100
Unmarried 58 22 21 100
a
SOURCE: Congressional Budget Office tabulations of data from the March 1996 Current Population Survey.
a. Unmarried couples are those living together and reporting as partners.

68 FOR BETTER OR FOR WORSE: MARRIAGE AND THE FEDERAL INCOME TAX June 1997
Table C-4.
Simulated Marriage Penalties and Bonuses for Married and Unmarried Couples, 1995
Married Unmarried
Couples Couples
a
Number of Couples (Thousands)
With penalties 26,800 1,480
Unaffected 6,350 300
With bonuses 21,520
870
Total 54,670 2,650
Percentage of Couples
With penalties 49 56
Unaffected 12 11
With bonuses 39
33
Total 100 100
Average Penalty 1,200 770
Average Bonus 1,140 1,020
Total Penalties (Millions of dollars) 32,040 1,140
Total Bonuses (Millions of dollars) 24,540 890
SOURCE: Congressional Budget Office simulations based on data from the March 1996 Current Population Survey.
a. Unmarried couples are those living together and reporting as partners.

T
Appendix D
Additional Supporting Tables
he following four tables D-1 through D-4
provide additional information about marriage
penalties and bonuses. Table D-1 shows the
relative importance of factors that affect the tax liabili-
ties of married couples. Table D-2 illustrates the distri-
bution of married couples by the level of earnings of
each spouse. Table D-3 demonstrates how the division
of earnings between spouses influences the likelihood
that a couple would incur a penalty or receive a bonus,
as well as the size of the penalty or bonus. Table
D-4 supporting Table 7 and Table 8 in Chapter 3
reveals how penalties and bonuses vary with the num-
ber of earners that a couple has.

70 FOR BETTER OR FOR WORSE: MARRIAGE AND THE FEDERAL INCOME TAX June 1997
Table D-1.
Factors Determining Marriage Penalties and Bonuses by Adjusted Gross Income, Simulated 1996
All Less Than $20,000- $50,000- More Than
Return Category Incomes $20,000 $50,000 $100,000 $100,000
Thousands of Returns
With Penalty 20,880 1,120 8,050 8,990 2,730
Tax penalty only 10,760 30 2,360 5,970 2,400
EITC penalty only 880 490 240 150 a
Both tax and EITC penalties 6,840 300 4,150 2,190 210
Tax penalty exceeds EITC bonus 00000
EITC penalty exceeds tax bonus 2,400 290 1,310 680 120
With Neither Penalty nor Bonus 3,130 2,320 260 550 10
With Bonus 25,260 5,760 10,040 7,170 2,290
Tax bonus only 20,030 4,160 8,100 5,800 1,970
EITC bonus only 680 670 10 0 0
Both tax and EITC bonuses 1,100 580 520 0 0
Tax bonus exceeds EITC penalty 3,450 350 1,410 1,370 320
EITC bonus exceeds tax penalty 00000
All Returns 49,270 9,190 18,351 16,700 5,020
Percentage of Returns in Income Category
With Penalty 4212445454
Tax penalty only 22 0 13 36 48
EITC penalty only 25110
Both tax and EITC penalties 14 3 23 13 4
Tax penalty exceeds EITC bonus 00000
EITC penalty exceeds tax bonus 53742
With Neither Penalty nor Bonus 6 25 1 3 0
With Bonus 51 63 55 43 46
Tax bonus only 41 45 44 35 39
EITC bonus only 17000
Both tax and EITC bonuses 26300
Tax bonus exceeds EITC penalty 74886
EITC bonus exceeds tax penalty 00000
All Returns 100 100 100 100 100
SOURCE: Congressional Budget Office simulations based on data from the 1993 Statistics of Income.
NOTE: EITC = earned income tax credit.
a. Less than 5,000.

APPENDIX D ADDITIONAL SUPPORTING TABLES 71
Table D-2.
Married Couples by Earnings of Each Spouse, Simulated 1996 (Percentage of all married couples)
Earnings of Higher-Earning Spouse
Earnings of All
Lower-Earning No Less Than $10,000- $20,000- $30,000- $50,000- $75,000- More Than Earnings
Spouse Earnings $10,000 $20,000 $30,000 $50,000 $75,000 $100,000 $100,000 Levels
No Earnings 10765741244
Less Than $10,000 * 344631121
$10,000 - $20,000 * * 35621a15
$20,000 - $30,000 * * * 3 6 2 a a 11
$30,000 - $50,000 ****421a7
$50,000 - $75,000 *****1aa1
$75,000 - $100,000 ******aaa
More Than $100,000 *******aa
All Earnings Levels 10 10 13 17 28 14 4 5 100
SOURCE: Congressional Budget Office simulations based on data from the 1993 Statistics of Income.
NOTE: * = Situation cannot occur because lower-earning spouse must have earnings less than those of higher-earning spouse.
a. Less than 0.5 percent.

72 FOR BETTER OR FOR WORSE: MARRIAGE AND THE FEDERAL INCOME TAX June 1997
Table D-3.
Married Couples with Marriage Penalties or Bonuses and Average Penalty or
Bonus by Earnings of Each Spouse, Simulated 1996
Earnings of Higher-Earning Spouse
All
No Less Than $10,000- $20,000- $30,000- $50,000- $75,000- More Than Earnings
Measure Earnings $10,000 $20,000 $30,000 $50,000 $75,000 $100,000 $100,000 Levels
Lower-Earning Spouse Had No Earnings
Percentage with Penalties000000000
Average Penalty (Dollars) n.a. n.a. n.a. n.a. n.a. n.a. n.a. n.a. n.a.
Percentage with Bonuses 86 68 88 98 99 99 99 99 89
Average Bonus (Dollars) 1,410 1,060 1,010 1,010 1,270 2,210 2,550 3,270 1,470
Lower-Earning Spouse Earned Less Than $10,000
Percentage with Penalties * 59 71 70 58 38 25 24 58
Average Penalty (Dollars) * 760 1,110 1,110 1,090 1,070 1,030 1,360 1,060
Percentage with Bonuses *3929304262757642
Average Bonus (Dollars) * 340 580 580 800 1,260 1,350 2,100 890
Lower-Earning Spouse Earned $10,000 to $20,000
Percentage with Penalties * *96927274716782
Average Penalty (Dollars) * * 1,760 1,130 1,410 1,460 1,550 1,760 1,400
Percentage with Bonuses * * 1 4 24 26 29 33 15
Average Bonus (Dollars) * * a 60 390 570 820 1,390 490
Lower-Earning Spouse Earned $20,000 to $30,000
Percentage with Penalties * * * 82 85 94 82 84 86
Average Penalty (Dollars) * * * 720 950 1,200 1,290 2,270 1,000
Percentage with Bonuses * * * 5 7 6 17 15 7
Average Bonus (Dollars) * * * 10 70 240 330 510 140
Lower-Earning Spouse Earned $30,000 to $50,000
Percentage with Penalties****9399979896
Average Penalty (Dollars)****1,5701,8901,9303,4501,830
Percentage with Bonuses****20311
Average Bonus (Dollars)****an.a.11064050
- - - - - - - - - - - - - - - - - - - - - - - - - - - - - - - - - - - - - - - - - - - - - - - - - - - - - - - - - - - - - - - - - - - - - - - - - - - - - - - - - - - - - - - - - - - - - - - - -
SOURCE: Congressional Budget Office simulations based on data from the 1993 Statistics of Income.

APPENDIX D ADDITIONAL SUPPORTING TABLES 73
Table D-3.
Continued
Earnings of Higher-Earning Spouse
All
No Less Than $10,000- $20,000- $30,000- $50,000- $75,000- More Than Earnings
Measure Earnings $10,000 $20,000 $30,000 $50,000 $75,000 $100,000 $100,000 Levels
Lower-Earning Spouse Earned $50,000 to $75,000
Percentage with Penalties*****99999999
Average Penalty (Dollars)*****2,2802,8405,2303,090
Percentage with Bonuses*****0bbb
Average Bonus (Dollars)*****n.a.ccc
Lower-Earning Spouse Earned $75,000 to $100,000
Percentage with Penalties******979999
Average Penalty (Dollars)******4,0707,3006,120
Percentage with Bonuses******0bb
Average Bonus (Dollars)******n.a.cc
Lower-Earning Spouse Earned More Than $100,000
Percentage with Penalties*******9999
Average Penalty (Dollars)*******12,05012,050
Percentage with Bonuses*******bb
Average Bonus (Dollars)*******cc
All Earnings Levels of Lower-Earning Spouse
Percentage with Penalties 0 15 41 56 55 52 46 35 42
Average Penalty (Dollars) n.a. 760 1,400 1,030 1,240 1,550 1,850 3,900 1,380
Percentage with Bonuses 86 60 53 40 41 48 53 64 51
Average Bonus (Dollars) 1,410 940 930 890 1,020 1,800 2,030 2,930 1,300
NOTES: Percentages in each earnings category may not add to 100 percent because some couples neither incur penalties nor receive bonuses.
n.a. = not applicable.
* = Situation cannot occur because lower-earning spouse must have earnings less than those of higher-earning spouse.
a. Less than 50 cents.
b. Less than 0.5 percent.
c. Too few cases to provide meaningful measure.

74 FOR BETTER OR FOR WORSE: MARRIAGE AND THE FEDERAL INCOME TAX June 1997
Table D-4.
Distribution of Marriage Penalties and Bonuses by Number of Earners, Simulated 1996
Number of Earners in Couple All
None One Two Returns
Joint Returns (Millions)
With Penalty 0 0 20,900 20,900
Unaffected 700 1,600 800 3,100
With Bonus 4,100
15,300 5,900 25,300
All Returns 4,800 16,900 27,500 49,300
Joint Returns (Percent)
With Penalty 0 0 76 42
Unaffected 14 10 3 6
With Bonus 86
90 21 51
All Returns 100 100 100 100
Total Value for Joint Returns (Millions of dollars
)
Penalty 0 0 28,800 28,800
Bonus -5,800 -22,600 -4,400 -32,900
Average Penalty or Bonus for Joint Returns (Dollars)
Penalty n.a. n.a. 1,380 1,380
Bonus -1,410 -1,480 -760 -1,300
Net Effect on Tax Liability -5,800 -22,600 24,300 -4,100
a
SOURCE: Congressional Budget Office simulations based on data from the 1993 Statistics of Income.
NOTE: n.a. = not applicable.
a. Positive values indicate net penalties; negative values indicate net bonuses.

T
Appendix E
Sources of Data
he analysis reported in this study uses two
sources of data about married couples: the
Internal Revenue Service's Statistics of In-
come (SOI) and the Current Population Survey (CPS)
from the Bureau of the Census. The SOI provides the
basis for estimating the magnitudes of marriage penal-
ties and bonuses in Chapter 3 and the effects of the op-
tions described in Chapter 5. The CPS was used to ex-
amine labor market and demographic changes since
1969, discussed in Chapter 4.
Statistics of Income
This study uses data from the 1993 SOI to estimate
marriage penalties and bonuses. The SOI is an annual
database created by the Internal Revenue Service (IRS).
The 1993 file consists of extensive data reported on the
individual federal income tax returns filed by a
nonrandom sample of nearly 105,000 taxpayers during
1994. The IRS selects sample returns based on their
usefulness in analyzing the income tax and in modeling
tax policy. In practice, the likelihood of the IRS select-
ing a return is inversely related to the amount of income
reported; that is, the file contains relatively more re-
turns with large positive or negative incomes than re-
turns with smaller incomes. For example, the 1993
SOI includes all individual tax returns reporting income
greater than $10 million or losses greater than $5 mil-
lion, but only one out of every 3,000 returns with posi-
tive income less than $30,000. The IRS assigns a
weight to each sample return equal to the inverse of its
probability of selection. Weighted counts of returns
thus represent all returns filed during 1994.
For each selected tax return, the SOI reports each
entry on the basic return (1040, 1040A, or 1040EZ, as
appropriate) as well as most of the information in-
cluded on accompanying schedules. In addition, the
1993 SOI includes information taken from W-2 forms
reporting the wage and salary incomes of husbands and
wives separately. (Joint tax returns show only the com-
bined earnings of husband and wife.) The SOI thus
provides most of the information about incomes needed
to simulate the taxes that spouses would pay if they
could file individual rather than joint returns. Note,
however, that the file does not indicate how the couple
would divide up dependents, itemized deductions, or
income from assets. The simulations used in the analy-
sis must therefore rely on assumptions about those divi-
sions, as described in Chapter 3.
Besides the basic limitations inherent in any data
set that only samples a portion of the entire population,
the SOI is further limited because it does not represent
the entire population. Because it samples only taxpay-
ers who filed returns during a given year, the SOI ex-
cludes nonfilers. In particular, the file underrepresents
people with incomes too low to owe taxes, other than
those who file tax returns to claim the earned income
tax credit or refunds of taxes withheld by employers.
Any analysis that examines the entire population must
thus rely on another source of data.
Current Po
p
ulation Surve
y
The CPS is an annual microdata file created by the Bu-
reau of the Census that represents the noninstitu-

76 FOR BETTER OR FOR WORSE: MARRIAGE AND THE FEDERAL INCOME TAX June 1997
tionalized U.S. population. Each month the Census
Bureau interviews members of approximately 60,000
households concerning their demographic and employ-
ment characteristics, primarily to obtain information for
estimating unemployment statistics. In March of each
year, the bureau supplements the basic CPS with ques-
tions about incomes from a variety of sources received
during the previous calendar year by each member of
sampled households. Each reporting unit (household,
family, and individual) is assigned a weight equal to the
inverse of the probability of that unit's selection for in-
terviewing. Weighted tabulations of variables included
in the March CPS thus provide representative estimates
of values for the entire noninstitutionalized population.
Data files are available for the annual March CPS be-
ginning in the late 1960s.
The CPS has a variety of shortcomings that limit its
usefulness for analysis. First, incomes reported to the
CPS are substantially less than the values that indepen-
dent sources of data would predict, particularly for un-
earned income such as transfer income, interest, rents,
and dividends. Second, the Census Bureau "topcodes"
income values, reporting high incomes only as being
above a fixed level. Thus, for example, the CPS shows
earnings from a single job only up to $99,999. In the
March 1996 CPS, values above the topcoding level are
reported as the mean of all topcoded values. In earlier
years, the CPS only showed the topcode value for
amounts above that level. For all years, the CPS thus
provides only limited information about units with the
highest incomes.
Topcoding makes it impossible to determine the
precise division of earnings between spouses for high-
income couples. In those cases less than 1 percent of
couples with incomes above $100,000 in 1995 the
analysis reported in Chapter 4 categorized both spouses
as having more than one-third of the couple's combined
earnings. Finally, because the CPS has changed over
time, the data collected in different years are not fully
comparable. Changes in data collection methods, the
questionnaire used, and levels of topcoding all create
differences that can be only partially corrected.
Despite its shortcomings, the Current Population
Survey provided the information necessary to examine
demographic changes in working-age married couples
over time, presented in Chapter 4.

T
Appendix F
Estimated Marriage Penalties and
Bonuses Under a Divorce Model
he estimated magnitudes of marriage penalties
and bonuses provided in Chapter 3 assume
that the higher-earning spouse would claim
most of a couple's children as dependents if the couple
were allowed to file individual tax returns. The lower-
earning spouse would claim at most one child and that
is only if the couple had at least two children. That as-
signment of children for the purpose of tax filing gen-
erally but not always results in a smaller tax liability
for the couple under individual filing.
An alternative approach would assign all children
to the lower-earning spouse, more closely approximat-
ing the fact that children generally go with the mother
when couples divorce and that, on average, women earn
less than men. If the simulations reported in Chapter 3
used this alternative assumption to estimate the taxes
couples would owe if they could file individual returns,
they would find fewer couples incurring penalties and
more receiving bonuses (see Table F-1). Simulated
total bonuses would be two-thirds larger up from $33
billion to $55 billion and total penalties would drop
from $29 billion to $25 billion. The estimated net bo-
nus resulting from requiring married couples to file
joint tax returns would thus jump from $4 billion to
$30 billion. In addition, the estimated average penalty
incurred by penalized couples would fall from $1,380
to $1,300, whereas the average bonus for couples re-
ceiving one would increase by half from $1,300 to
$1,960.
Two points are worth noting. First, the changes in
estimated penalties and bonuses as a result of reassign-
ing children occur because shifting children from the
tax return of the higher-earning spouse to that of the
lower-earner raises the couple's tax liability under indi-
vidual filing. The higher earner generally loses the op-
tion of filing a head-of-household return and thus faces
a higher tax rate and loses personal exemptions for the
children. Although some lower-earning spouses would
lose the benefits of the earned income tax credit under
the alternative assumption, others would have exemp-
tions they could not use fully and possibly lower tax
rates that would apply to low or no taxable income.
When higher individual tax liabilities provide the base-
line against which penalty or bonus status is deter-
mined, penalties shrink and bonuses grow.
Second, although assigning all children to the
lower-earning spouse may better represent the way chil-
dren would be allocated if the couple were to divorce,
estimates of penalties and bonuses should use that as-
signment only if the policy alternative to joint tax filing
is divorce and consequent individual filing. If the rele-
vant alternative is not divorce but individual filing un-
der which the couple chooses how to allocate children
between returns, the assignment used in the simulations
for Chapter 3 is more appropriate.

78 FOR BETTER OR FOR WORSE: MARRIAGE AND THE FEDERAL INCOME TAX June 1997
Table F-1.
Marriage Penalties and Bonuses for Married Couples Under Alternative Assumptions
about Distribution of Children Between Spouses, Simulated 1996
All Children
Children Assigned
Assigned to Lower-
as in Earning
Simulations Spouse
a
Number of Couples (Thousands)
With Penalties 20,900 19,300
Unaffected 3,100 1,800
With Bonuses 25,300
28,100
Total 49,300 49,300
Percentage of Couples
With Penalties 42 39
Unaffected 6 4
With Bonuses 51
57
Total 100 100
Total Value (Millions of dollars)
Penalties 28,800 25,200
Bonuses 32,900 55,200
Average Penalty or Bonus (Dollars)
Penalty 1,380 1,300
Bonus 1,300 1,960
SOURCE: Congressional Budget Office simulations based on data from the 1993 Statistics of Income.
a. The couple's first child is assigned to the higher-earning spouse, the second child to the lower-earning spouse, and all other children to the higher-
earning spouse.

W
Appendix G
The Income Distribution
of Families
orking-age married couples generally have
higher incomes than their unmarried counter-
parts and elderly families, and thus tend to
face higher tax rates because of the progressivity of the
federal income tax. Data from the March 1996 Current
Population Survey indicate that just over one-third of
all families had incomes below $20,000 in 1995, a sim-
ilar fraction had incomes between $20,000 and
$50,000, about one-fifth had incomes between $50,000
and $100,000, and about one-sixteenth had incomes ex-
ceeding $100,000 (see Table G-1).
Working-age single parents those 25 through 64
years old had the lowest incomes in 1995, with 55
percent receiving less than $20,000 annually and only 8
percent receiving $50,000 or more. Working-age,
childless, single people are somewhat better off: 43
percent received less than $20,000, and 13 percent re-
ceived $50,000 or more. Elderly families had incomes
similar to those of working-age single parents.
Largely because nearly three-fourths of them had at
least two incomes, working-age married couples had the
highest incomes. One-seventh of those without chil-
dren had incomes of $100,000 or greater, and 42 per-
cent had incomes between $50,000 and $100,000.
Only one-tenth had incomes below $20,000. Their
counterparts with children were nearly as well off, with
one in eight families receiving at least $100,000 and
two-fifths receiving between $50,000 and $100,000.
The last quarter century has seen a greater concen-
tration of working-age couples who have incomes
above $50,000 (in 1995 dollars) and a smaller fraction
of couples with incomes below that level (see Table G-
2). Between 1969 and 1995, couples with total income
above $50,000 (in 1995 dollars) became relatively
more common, increasing from 38 percent to 56 per-
cent of all couples. Most of the shift in income shares
took place during the 1970s. There was movement out
of the middle-income ranges to both higher- and lower-
income categories during the 1980s, but little change
has occurred in the distribution since 1989. Those
shifts reflect two offsetting factors. First, the earnings
of younger workers declined markedly between 1969
and 1995, leading to lower incomes for younger fami-
lies. At the same time, the aging of the baby-boom
generation and the rising proportion of two-earner cou-
ples have increased the incomes of many couples. Many
observers have suggested that the increasing number of
two-earner couples has been a response to declining
wages.

80 FOR BETTER OR FOR WORSE: MARRIAGE AND THE FEDERAL INCOME TAX June 1997
Table G-1.
Percentage Distribution of Families by Income Category and Family Type, 1995
Working-Age
Working-Age Single Working-Age
Childless Working-Age Individuals Couples
Income of Single Childless with with Elderly All
Taxable Unit Individuals Couples Children Children Families Families
Less Than $20,000 43 10 55 10 53 36
$20,000 - $50,000 43 33 36 38 34 37
$50,000 - $100,000 11 42 7 40 10 21
More Than $100,000 2
15 1 12 3 6
All Families 100 100 100 100 100 100
SOURCE: Congressional Budget Office tabulations of data from the March 1996 Current Population Survey.
NOTES: Working-age individuals are people between ages 25 and 64, inclusive. Working-age couples are those in which both spouses are in that
age range.
Families are groups of related individuals living together. Individuals not living with relatives are included as one-person families.

APPENDIX G THE INCOME DISTRIBUTION OF FAMILIES 81
Table G-2.
Distribution of Working-Age Married Couples with Earnings by Income Category
in 1969, 1979, 1989, and 1995
Couple's Total Income
(1995 dollars) 1969 1979 1989 1995
Less Than $20,000 8 6 7 8
$20,000 -$50,000 54 42 37 37
$50,000 -$100,000 33 43 43 42
More Than $100,000 4 9 13 14
SOURCE: Congressional Budget Office tabulations of data from the March Current Population Surveys for 1970, 1980, 1990, and 1996.


T
Appendix H
Comparison of Demographic Changes for
Working-Age Couples and All Married Couples
he demographic analysis reported in this study
relies primarily on data from the March Cur-
rent Population Survey, issued annually by the
Bureau of the Census. Those data include demographic
and income information for a sample of about 150,000
people, along with weights to allow the calculation of
statistics representing the noninstitutional population of
the United States. The analysis focuses on married
couples during the 1969-1993 period.
Because marriage penalties and bonuses primarily
affect couples who work, the analysis covers only
working-age couples with earnings. That limitation
imposed the following three requirements on couples:
both spouses must be between ages 25 and 64, inclu-
sive; neither spouse can report negative earnings (in
general, negative earnings result from losses in self-em-
ployment activities); and at least one spouse has to
have positive earnings.
Those limitations eliminated 27 percent of all mar-
ried couples from the analyzed 1993 population (see
Table H-1). Of the 27 percent, 12 percent violated the
age limits but not the earnings requirements, another 12
percent satisfied neither the age nor income limits, and
3 percent failed to meet the income requirements in
cases in which both spouses were in the appropriate age
range.
In the case of more than one-half of the couples
who were removed from the analysis because of age,
both spouses were 65 years old or older. Another one-
fifth had elderly husbands. Among nearly all of the
other excluded couples, either the wife or both spouses
were under age 25. Just 5 percent of the omitted cou-
ples were dropped from the analysis because the hus-
band was too young or the wife too old. Of the 3 per-
cent of couples excised solely on the basis of earnings,
nearly all had no earnings.
Limiting the analyzed population to working-age
couples increased the proportion of couples with two
earners, largely because many of those omitted were
elderly couples who did not work (see Table H-2).
Both populations, however, had substantial increases in
proportions of two-earner couples over the 1969-1995
period.
Text tables 9 through 15 show the demographic
changes that occurred between 1969 and 1995 for
working-age married couples with earnings. Tables H-
3 through H-9 repeat those tables, adding comparable
data for all married couples to allow comparison of the
changes for the smaller and the more inclusive groups.
The tables show similar qualitative trends with differ-
ences that would be expected when older, younger, and
nonworking couples were excluded. For example, Ta-
ble H-3 shows that all married couples followed the
same trend of declining shares of one-earner couples
and greater equality of earnings between spouses as
was observed for working-age couples with earnings.
Including couples with spouses over age 64 or under
age 25 increases the share of couples with one earner,
but does not alter the fact that such couples were sub-
stantially less common in 1995 than in 1969. Similar
observations hold for other demographic changes.

84 FOR BETTER OR FOR WORSE: MARRIAGE AND THE FEDERAL INCOME TAX June 1997
Table H-1.
Selection of Married Couples for Analysis Based on Age and Earnings, 1995
Number Distribution
Category (Thousands) (Percent)
All Married Couples 54,650 100
Couples Excluded by Age but Not Earnings
Both spouses age 65 or over 1,400 3
Husband age 65 or over, wife age 25 through 64 1,550 3
Husband age 25 through 64, wife under age 25 1,250 2
Both spouses under age 25 1,150 2
Other 500 1
Couples Excluded by Earnings but Not Age
Both spouses have zero earnings 1,650 3
At least one spouse reports negative earnings 100 a
Couples Excluded by Both Age and Earnings
Both spouses age 65 or over 5,650 10
Husband age 65 or over, wife age 25 through 64 1,100 2
Husband age 25 through 64, wife under age 25 50 a
Both spouses under age 25 50 a
Other 200 a
Married Couples Selected for Analysis 40,100 73
b
SOURCE: Congressional Budget Office tabulations of data from the March 1996 Current Population Survey.
a. Less than 0.5 percent.
b. Both spouses age 25 through 64, neither spouse has negative earnings, and at least one spouse has positive earnings.

APPENDIX H COMPARISON OF DEMOGRAPHIC CHANGES FOR WORKING-AGE COUPLES AND ALL MARRIED COUPLES 85
Table H-2.
Percentage of Couples with Two Earners: All Married Couples and
Working-Age Married Couples with Positive Earnings in 1969, 1979, 1989, and 1995
Population Group 1969 1979 1989 1995
All Married Couples
with Earnings 45.2 51.7 58.0 58.4
Working-Age Married Couples
with Positive Earnings 48.3 59.6 70.5 71.8
SOURCE: Congressional Budget Office tabulations of data from the March Current Population Surveys for 1970, 1980, 1990, and 1996.

86 FOR BETTER OR FOR WORSE: MARRIAGE AND THE FEDERAL INCOME TAX June 1997
Table H-3.
Distribution of Working-Age and All Married Couples by Division
of Earnings Between Spouses in 1969, 1979, 1989, and 1995
Lower-Earning
Each Spouse Spouse Had Some
Earned at Least Earnings but Less Neither Spouse or
One-Third of Than One-Third of Only One
Year Couple's Earnings Couple's Earnings Had Earnings All Couples
Thousands of Working-Age Married Couples
1969 5,600 10,100 16,700 32,400
1979 7,500 12,700 13,700 34,000
1989 11,800 15,100 11,300 38,200
1995 13,600 15,200 11,300 40,100
Percentage of All Working-Age Married Couples
1969 17.2 31.2 51.7 100.0
1979 22.2 37.4 40.4 100.0
1989 30.9 39.5 29.5 100.0
1995 33.9 37.9 28.2 100.0
Thousands of Married Couples
1969 7,200 13,200 24,700 45,100
1979 9,300 15,900 23,600 48,800
1989 13,300 17,600 22,400 53,300
1995 14,800 17,100 22,800 54,700
Percentage of All Married Couples
1969 16.0 29.2 54.8 100.0
1979 19.2 32.6 48.3 100.0
1989 25.0 33.0 42.0 100.0
1995 27.1 31.3 41.6 100.0
SOURCE: Congressional Budget Office tabulations of data from the March Current Population Surveys for 1970, 1980, 1990, and 1996.
NOTE: Working-age married couples include only those in which both spouses are between ages 25 and 64, neither spouse has negative earnings,
and at least one spouse has positive earnings.

APPENDIX H COMPARISON OF DEMOGRAPHIC CHANGES FOR WORKING-AGE COUPLES AND ALL MARRIED COUPLES 87
Table H-4.
Percentage Distribution of Working-Age and All Married Couples
with Two Earners by Total Income in 1969, 1979, 1989, and 1995
Couple's Income (1995 dollars)
Less Than $20,000- $50,000- More Than
Year $20,000 $50,000 $100,000 $100,000 All Incomes
Working-Age Married Couples
1969 28.5 46.0 62.7 43.0 48.3
1979 29.5 56.3 73.4 56.7 59.6
1989 38.0 66.6 82.7 78.7 70.5
1995 30.9 69.7 87.0 78.6 71.8
All Married Couples
1969 21.5 49.1 63.5 42.7 45.2
1979 17.7 58.8 73.6 56.3 51.7
1989 18.3 67.4 82.3 78.1 58.0
1995 15.4 69.6 86.4 78.0 58.4
SOURCE: Congressional Budget Office tabulations of data from the March Current Population Surveys for 1970, 1980, 1990, and 1996.
NOTE: Working-age married couples include only those in which both spouses are between ages 25 and 64, neither spouse has negative earnings,
and at least one spouse has positive earnings.

88 FOR BETTER OR FOR WORSE: MARRIAGE AND THE FEDERAL INCOME TAX June 1997
Table H-5.
Percentage Distribution of Working-Age and All Married Couples by Division of Earnings
Between Spouses and Total Earningsin 1969, 1979, 1989, and 1995
Both Spouses Had
Each Spouse Earnings and One Spouse
Earned at Least Contributed More Neither Spouse or
One-Third of Than Two-Thirds of Only One
Year Couple's Earnings Couple's Earnings Had Earnings
Working-Age Married Couples
All Income Categories
1969 17.2 31.2 51.7
1979 22.2 37.4 40.4
1989 30.9 39.5 29.5
1995 33.9 37.9 28.2
Income Less Than $20,000
1969 7.1 21.4 71.5
1979 9.7 19.9 70.5
1989 12.3 25.7 62.0
1995 11.6 19.3 69.1
Income $20,000 to $50,000
1969 14.9 31.1 54.0
1979 20.3 36.0 43.7
1989 27.3 39.4 33.4
1995 32.1 37.6 30.3
Income $50,000 to $100,000
1969 27.4 35.4 37.3
1979 29.3 44.1 26.6
1989 40.2 42.5 17.3
1995 44.4 42.7 13.0
Income More Than $100,000
1969 9.9 33.1 57.0
1979 16.0 40.6 43.3
1989 32.5 46.3 21.3
1995 32.5 46.1 21.4
- - - - - - - - - - - - - - - - - - - - - - - - - - - - - - - - - - - - - - - - - - - - - - - - - - - - - - - - - - - - - - - - - - - - - - - - - - - - - - - - - - - - - -
(Continued)

APPENDIX H COMPARISON OF DEMOGRAPHIC CHANGES FOR WORKING-AGE COUPLES AND ALL MARRIED COUPLES 89
Table H-5.
Continued
Both Spouses Had
Each Spouse Earnings and One Spouse
Earned at Least Contributed More Neither Spouse or
One-Third of Than Two-Thirds of Only One
Year Couple's Earnings Couple's Earnings Had Earnings
All Married Couples
All Income Categories
1969 16.0 29.2 54.8
1979 19.2 32.6 48.3
1989 25.0 33.0 42.0
1995 27.1 31.3 41.6
Income Less Than $20,000
1969 5.3 16.2 78.5
1979 5.1 12.6 82.3
1989 5.5 12.8 81.7
1995 5.3 10.1 84.6
Income $20,000 to $50,000
1969 16.3 32.7 50.9
1979 21.6 37.2 41.2
1989 27.7 39.7 32.6
1995 31.9 37.6 30.4
Income $50,000 to $100,000
1969 28.3 35.2 36.5
1979 29.7 44.0 26.4
1989 39.9 42.5 17.7
1995 43.8 42.6 13.6
Income More Than $100,000
1969 9.7 33.0 57.3
1979 15.7 40.6 43.7
1989 31.8 46.3 21.9
1995 31.4 46.6 22.0
SOURCE: Congressional Budget Office tabulations of data from the March Current Population Surveys for 1970, 1980, 1990, and 1996.
NOTES: Working-age married couples include only those in which both spouses are between ages 25 and 64, neither spouse has negative earnings,
and at least one spouse has positive earnings.
Incomes measured in 1995 dollars.

90 FOR BETTER OR FOR WORSE: MARRIAGE AND THE FEDERAL INCOME TAX June 1997
Table H-6.
Percentage Distribution of Working-Age and All Married Couples with Two Earners
by Age of Older Spouse in 1969, 1979, 1989, and 1995
Age of Older Spouse All Age
Year 25-34 35-44 45-54 55-64 Groups
Working-Age Married Couples
1969 46.5 49.5 51.2 44.8 48.3
1979 67.7 63.5 59.8 44.8 59.6
1989 76.0 74.2 71.8 54.0 70.5
1995 76.7 74.1 74.2 57.9 71.8
All Married Couples
1969 54.4 49.5 50.9 29.4 45.2
1979 69.0 63.3 58.8 25.5 51.7
1989 74.6 73.4 70.5 27.4 58.0
1995 74.9 72.8 72.6 28.3 58.4
SOURCE: Congressional Budget Office tabulations of data from the March Current Population Surveys for 1970, 1980, 1990, and 1996.
NOTE: Working-age married couples include only those in which both spouses are between ages 25 and 64, neither spouse has negative earnings,
and at least one spouse has positive earnings.

APPENDIX H COMPARISON OF DEMOGRAPHIC CHANGES FOR WORKING-AGE COUPLES AND ALL MARRIED COUPLES 91
Table H-7.
Percentage Distribution of Working-Age and All Married Couples by Division of Earnings
Between Spouses and Age of Older Spouse in 1969, 1979, 1989, and 1995
Both Spouses Had
Each Spouse Earnings and One Spouse
Earned at Least Contributed More Neither Spouse or
One-Third of Than Two-Thirds of Only One
Year Couple's Earnings Couple's Earnings Had Earnings
Working-Age Married Couples
All Age Groups
1969 17.2 31.2 51.7
1979 22.2 37.4 40.4
1989 30.9 39.5 29.5
1995 33.9 37.9 28.2
Older Spouse 25-34 Years Old
1969 15.2 31.4 53.5
1979 27.4 40.3 32.3
1989 36.2 39.8 24.0
1995 39.9 36.7 23.3
Older Spouse 35-44 Years Old
1969 14.7 34.8 50.5
1979 21.9 41.6 36.5
1989 32.2 42.0 25.8
1995 34.8 39.3 25.9
Older Spouse 45-54 Years Old
1969 19.5 31.7 48.8
1979 21.0 38.7 40.2
1989 31.0 40.8 28.2
1995 33.8 40.4 25.8
Older Spouse 55-64 Years Old
1969 19.3 25.4 55.2
1979 17.8 27.0 55.2
1989 21.4 32.6 46.0
1995 25.8 32.1 42.1
- - - - - - - - - - - - - - - - - - - - - - - - - - - - - - - - - - - - - - - - - - - - - - - - - - - - - - - - - - - - - - - - - - - - - - - - - - - - - - - - - - - - - -
(Continued)

92 FOR BETTER OR FOR WORSE: MARRIAGE AND THE FEDERAL INCOME TAX June 1997
Table H-7.
Continued
Both Spouses Had
Each Spouse Earnings and One Spouse
Earned at Least Contributed More Neither Spouse or
One-Third of Than Two-Thirds of Only One
Year Couple's Earnings Couple's Earnings Had Earnings
All Married Couples
All Age Groups
1969 16.0 29.2 54.8
1979 19.2 32.6 48.3
1989 25.0 33.0 42.0
1995 27.1 31.3 41.6
Older Spouse 25-34 Years Old
1969 19.2 35.2 45.6
1979 27.4 41.6 31.0
1989 34.7 40.0 25.4
1995 37.0 37.9 25.1
Older Spouse 35-44 Years Old
1969 14.5 35.0 50.5
1979 21.5 41.8 36.7
1989 31.4 42.0 26.6
1995 34.1 38.7 27.2
Older Spouse 45-54 Years Old
1969 19.1 31.8 49.1
1979 20.2 38.6 41.2
1989 30.0 40.6 29.5
1995 33.0 39.6 27.4
Older Spouse 55-64 Years Old
1969 11.8 17.6 70.6
1979 9.9 15.6 74.5
1989 10.4 17.0 72.6
1995 12.0 16.3 71.7
SOURCE: Congressional Budget Office tabulations of data from the March Current Population Surveys for 1970, 1980, 1990, and 1996.
NOTE: Working-age married couples include only those in which both spouses are between ages 25 and 64, neither spouse has negative earnings,
and at least one spouse has positive earnings.

APPENDIX H COMPARISON OF DEMOGRAPHIC CHANGES FOR WORKING-AGE COUPLES AND ALL MARRIED COUPLES 93
Table H-8.
Percentage Distribution of Working-Age and All Married Couples with Two Earners
by Number of Children in 1969, 1979, 1989, and 1995
Two or More
Year No Children One Child Children All Couples
Working-Age Married Couples
1969 53.0 53.3 43.2 48.3
1979 59.9 65.0 56.4 59.6
1989 70.4 75.9 67.2 70.5
1995 71.6 76.9 69.1 71.8
All Married Couples
1969 43.4 54.0 43.0 45.2
1979 44.5 63.9 55.2 51.7
1989 48.4 72.8 65.3 58.0
1995 48.4 74.2 67.4 58.4
SOURCE: Congressional Budget Office tabulations of data from the March Current Population Surveys for 1970, 1980, 1990, and 1996.
NOTE: Working-age married couples include only those in which both spouses are between ages 25 and 64, neither spouse has negative earnings,
and at least one spouse has positive earnings.

94 FOR BETTER OR FOR WORSE: MARRIAGE AND THE FEDERAL INCOME TAX June 1997
Table H-9.
Percentage Distribution of Working-Age and All Married Couples by Division of Earnings
Between Spouses and Number of Children in 1969, 1979, 1989, and 1995
Both Spouses Had
Each Spouse Earnings and One Spouse
Earned at Least Contributed More Neither Spouse or
One-Third of Than Two-Thirds of Only One
Year Couple's Earnings Couple's Earnings Had Earnings
Working-Age Married Couples
All Couples
1969 17.2 31.2 51.7
1979 22.2 37.4 40.4
1989 30.9 39.5 29.5
1995 33.9 37.9 28.2
No Children
1969 24.4 28.6 47.0
1979 27.0 32.9 40.1
1989 34.3 36.2 29.6
1995 36.3 35.3 28.4
One Child
1969 19.3 34.1 46.7
1979 24.6 40.4 35.0
1989 34.9 41.1 24.1
1995 37.6 39.4 23.1
Two or More Children
1969 11.3 31.9 56.8
1979 16.3 40.1 43.6
1989 25.0 42.2 32.8
1995 29.2 39.9 30.9
- - - - - - - - - - - - - - - - - - - - - - - - - - - - - - - - - - - - - - - - - - - - - - - - - - - - - - - - - - - - - - - - - - - - - - - - - - - - - - - - - - - - - -
(Continued)

APPENDIX H COMPARISON OF DEMOGRAPHIC CHANGES FOR WORKING-AGE COUPLES AND ALL MARRIED COUPLES 95
Table H-9.
Continued
Both Spouses Had
Each Spouse Earnings and One Spouse
Earned at Least Contributed More Neither Spouse or
One-Third of Than Two-Thirds of Only One
Year Couple's Earnings Couple's Earnings Had Earnings
All Married Couples
All Couples
1969 16.0 29.2 54.8
1979 19.2 32.6 48.3
1989 25.0 33.0 42.0
1995 27.1 31.3 41.6
No Children
1969 19.7 23.7 56.6
1979 19.9 24.7 55.5
1989 23.0 25.4 51.6
1995 23.8 24.6 51.6
One Child
1969 18.0 36.0 46.0
1979 22.8 41.1 36.1
1989 32.1 40.8 27.2
1995 35.5 38.7 25.8
Two or More Children
1969 10.9 32.1 57.0
1979 15.7 39.6 44.8
1989 23.9 41.4 34.7
1995 28.2 39.2 32.6
SOURCE: Congressional Budget Office tabulations of data from the March Current Population Surveys for 1970, 1980, 1990, and 1996.
NOTE: Working-age married couples include only those in which both spouses are between ages 25 and 64, neither spouse has negative earnings,
and at least one spouse has positive earnings.
